

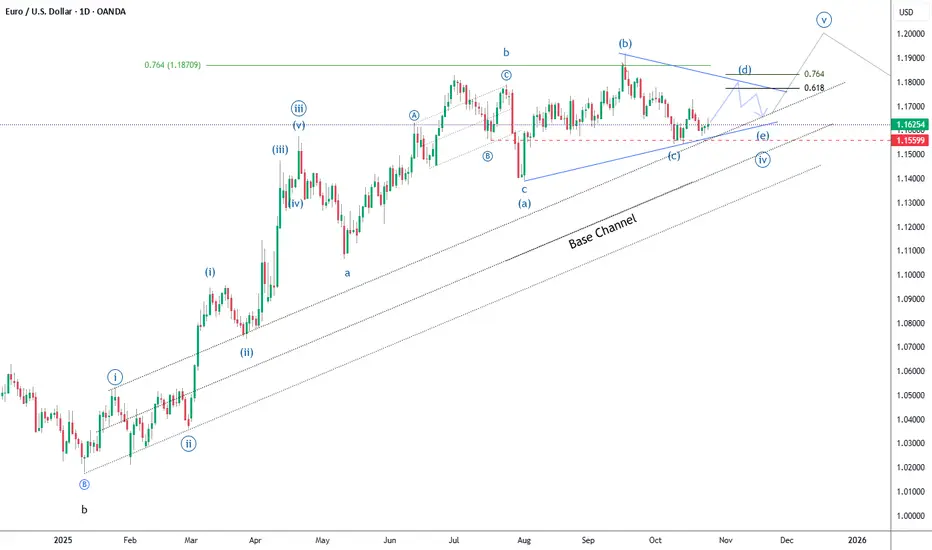
This EUR/USD chart shows the market undergoing a complex corrective phase, labelled as wave (iv), likely forming a triangle pattern (a)-(b)-(c)-(d)-(e) after an impulsive rally. The correction is taking place within a well-defined base channel, suggesting consolidation before a potential breakout into wave (v) targeting higher levels near 1.19–1.20. As long as the channel holds, the Elliott Wave structure supports a bullish continuation once the correction completes.
Keep following for regular breakdowns as the bigger trend unfolds.
Keep following for regular breakdowns as the bigger trend unfolds.
Ghi chú
4-Hour (4H) View:
The hourly detail reveals wave (d) in active progression, bouncing from the lower support line toward the upper triangle resistance. The internal structure shows clear a-b-c labelling, with price currently testing intermediate resistance levels.
Triangle Structure - Exact Levels:
Wave (b) Peak: 1.19190 – Upper triangle boundary
Wave (c) Low: 1.15410 – First support anchor
Wave (d) Low: 1.15517 – Current bounce origin
Base Channel Support: 1.16100-1.16447 – Secondary support zone
Fibonacci Targets within Wave (d):
0.618 Retracement: 1.17753 – Intermediate resistance
0.764 Retracement: 1.18305 – Higher resistance target
Current Setup:
Wave (d) is in the early stages of its wave (b) bounce from 1.15517. The next resistance test is the 0.618 Fibonacci level at 1.17753. A break above this zone targets the 0.764 level (~1.18305), while sustained trade above 1.19190 would invalidate the triangle pattern and confirm breakout into wave (v).
Giao dịch đang hoạt động
EUR/USD Wave Count Update – Nov 3, 2025
The Elliott Wave count has been refined, especially for Wave C, now reflecting new support and Fibonacci retracement levels.
The projected path has shifted, as shown in the updated chart, with possible bullish continuation toward the 1.16xx target zone.
Major support now aligns at [new wave C endpoint] and key risk parameters are adjusted.
See chart for detailed targets and invalidation zones.

Bài đăng liên quan
Thông báo miễn trừ trách nhiệm
Thông tin và các ấn phẩm này không nhằm mục đích, và không cấu thành, lời khuyên hoặc khuyến nghị về tài chính, đầu tư, giao dịch hay các loại khác do TradingView cung cấp hoặc xác nhận. Đọc thêm tại Điều khoản Sử dụng.
Thông báo miễn trừ trách nhiệm
Thông tin và các ấn phẩm này không nhằm mục đích, và không cấu thành, lời khuyên hoặc khuyến nghị về tài chính, đầu tư, giao dịch hay các loại khác do TradingView cung cấp hoặc xác nhận. Đọc thêm tại Điều khoản Sử dụng.