

Hammer Candle Stick Definition
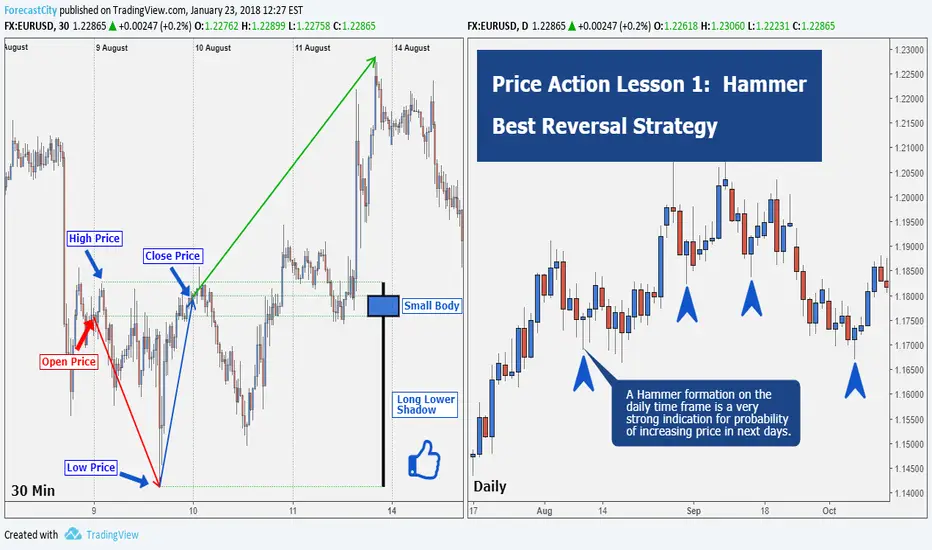
If there was a large drop in price in the middle of the day, but before the day ended it increased to what it was at the beginning of the day and even more, a significant upward return occurred. The candlestick of this change (move) will be a Hammer in a daily time frame. A Hammer formation on the daily time frame is a very strong indication for probability of increasing price in next days.
Example: The picture shows currency pair of EUR/USD in a 30 minute time frame. On Ausust 09, 2017 the price significantly decreased from 1.17495 to 1.16886 or even lower. But after that, it increased rapidly at the end of the day to 1.17578 and then closed.
Also in this picture - for better understanding - the Hammer Candlestick in the daily time frame - in the result of changes in a day - is drawn.
If there was a large drop in price in the middle of the day, but before the day ended it increased to what it was at the beginning of the day and even more, a significant upward return occurred. The candlestick of this change (move) will be a Hammer in a daily time frame. A Hammer formation on the daily time frame is a very strong indication for probability of increasing price in next days.
Example: The picture shows currency pair of EUR/USD in a 30 minute time frame. On Ausust 09, 2017 the price significantly decreased from 1.17495 to 1.16886 or even lower. But after that, it increased rapidly at the end of the day to 1.17578 and then closed.
Also in this picture - for better understanding - the Hammer Candlestick in the daily time frame - in the result of changes in a day - is drawn.
Ghi chú
Ghi chú
Price Action Lesson 3: Hammer, The first sign of the beginning Ascending wave
Ghi chú
Price Action Lesson 4: Weak hammer
Ghi chú
Price Action Lesson 5: Weak Hammer (Example)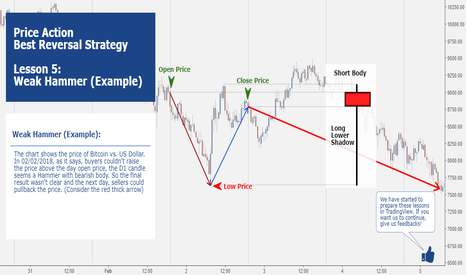

High Accurate forecasts by 4CastMachine AI
✅36 Forex Pairs
✅175 Cryptos
✅16 Indices
✅Gold, Silver...
👉Follow.ForecastCity.com
FREE Telegrams:
👉t.me/ForecastCity_com
✅36 Forex Pairs
✅175 Cryptos
✅16 Indices
✅Gold, Silver...
👉Follow.ForecastCity.com
FREE Telegrams:
👉t.me/ForecastCity_com
Thông báo miễn trừ trách nhiệm
Thông tin và các ấn phẩm này không nhằm mục đích, và không cấu thành, lời khuyên hoặc khuyến nghị về tài chính, đầu tư, giao dịch hay các loại khác do TradingView cung cấp hoặc xác nhận. Đọc thêm tại Điều khoản Sử dụng.
High Accurate forecasts by 4CastMachine AI
✅36 Forex Pairs
✅175 Cryptos
✅16 Indices
✅Gold, Silver...
👉Follow.ForecastCity.com
FREE Telegrams:
👉t.me/ForecastCity_com
✅36 Forex Pairs
✅175 Cryptos
✅16 Indices
✅Gold, Silver...
👉Follow.ForecastCity.com
FREE Telegrams:
👉t.me/ForecastCity_com
Thông báo miễn trừ trách nhiệm
Thông tin và các ấn phẩm này không nhằm mục đích, và không cấu thành, lời khuyên hoặc khuyến nghị về tài chính, đầu tư, giao dịch hay các loại khác do TradingView cung cấp hoặc xác nhận. Đọc thêm tại Điều khoản Sử dụng.