Fantom Daily Analysis
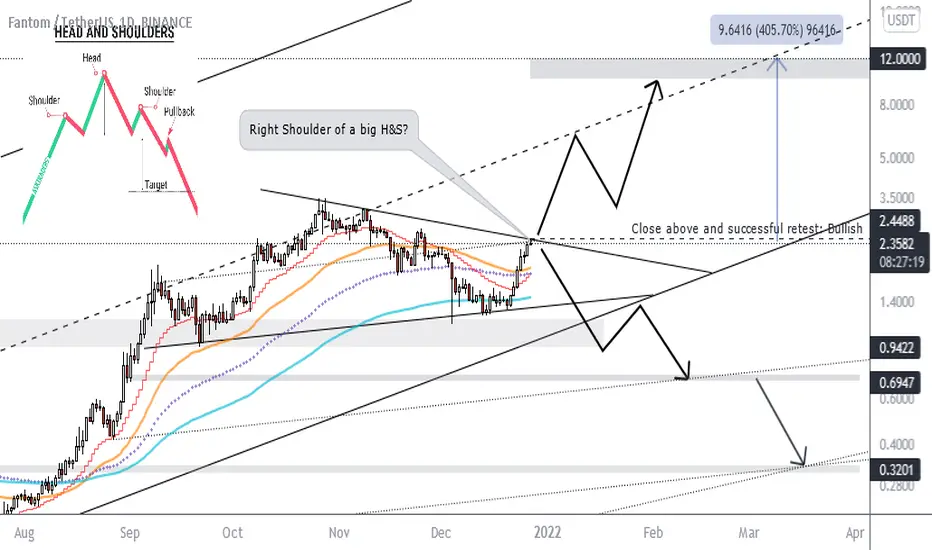
FTM is at the resistance of a triangle and the most important level to determine if it's going to be bullish or bearish. If a daily candle closes above 2.4488 the higher target at $12 is reachable. In another scenario if this level gets rejected the right shoulder of a head and shoulders pattern will be formed and in case of losing the support at $1.4 next supports to hold the price are 0.94, 0.69 and 0.32.

Bài đăng liên quan
Thông báo miễn trừ trách nhiệm
Thông tin và các ấn phẩm này không nhằm mục đích, và không cấu thành, lời khuyên hoặc khuyến nghị về tài chính, đầu tư, giao dịch hay các loại khác do TradingView cung cấp hoặc xác nhận. Đọc thêm tại Điều khoản Sử dụng.
Bài đăng liên quan
Thông báo miễn trừ trách nhiệm
Thông tin và các ấn phẩm này không nhằm mục đích, và không cấu thành, lời khuyên hoặc khuyến nghị về tài chính, đầu tư, giao dịch hay các loại khác do TradingView cung cấp hoặc xác nhận. Đọc thêm tại Điều khoản Sử dụng.