

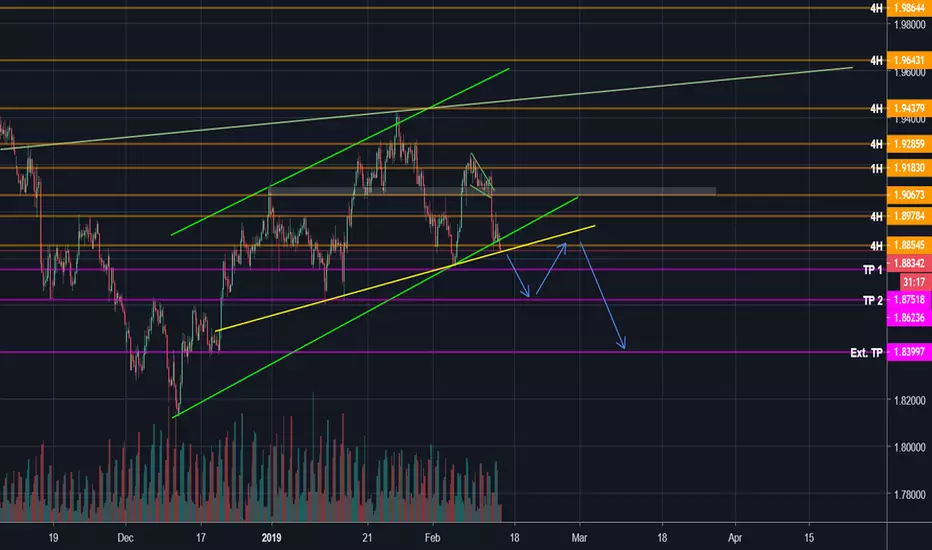
Observing 4H, Daily and Weekly chart, we can see bearish momentum. There are 2 ways to look at this current price formation.
Firstly, it is in an upward channel, touching the lower bound and looking to breakdown of it. (Indicated by green lines)
Secondly, you can see it as a H&S pattern, where price is currently at the neckline. (Indicated by yellow line)
Targets are marked at S&R levels, with TP 1 @ 1.87250, TP 2 @ 1.86240 and Extended TP @ 1.84000. Following a H&S target measurement (distance from head to neckline), melting down towards Ext. TP is possible.
After a breakdown, there is possibility of a pullback to either the neckline or the lower bound of the upward channel. At that point, it would be important to observe price action to decide on any addition of positions OR an entry.
Firstly, it is in an upward channel, touching the lower bound and looking to breakdown of it. (Indicated by green lines)
Secondly, you can see it as a H&S pattern, where price is currently at the neckline. (Indicated by yellow line)
Targets are marked at S&R levels, with TP 1 @ 1.87250, TP 2 @ 1.86240 and Extended TP @ 1.84000. Following a H&S target measurement (distance from head to neckline), melting down towards Ext. TP is possible.
After a breakdown, there is possibility of a pullback to either the neckline or the lower bound of the upward channel. At that point, it would be important to observe price action to decide on any addition of positions OR an entry.
Ghi chú
TP 1 HIT!
Thông báo miễn trừ trách nhiệm
Thông tin và các ấn phẩm này không nhằm mục đích, và không cấu thành, lời khuyên hoặc khuyến nghị về tài chính, đầu tư, giao dịch hay các loại khác do TradingView cung cấp hoặc xác nhận. Đọc thêm tại Điều khoản Sử dụng.
Thông báo miễn trừ trách nhiệm
Thông tin và các ấn phẩm này không nhằm mục đích, và không cấu thành, lời khuyên hoặc khuyến nghị về tài chính, đầu tư, giao dịch hay các loại khác do TradingView cung cấp hoặc xác nhận. Đọc thêm tại Điều khoản Sử dụng.