

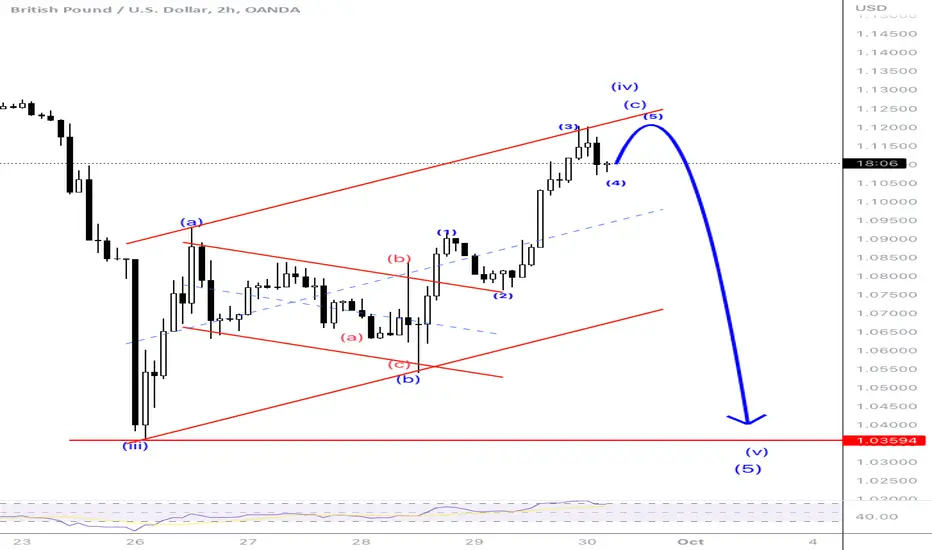
2hr chart outlook of GBPUSD suggests that a corrective structure from the low of 1.036 is in progress as an a- b -c . Wave a rally ended @ 1.09298, followed by a pull back - wave(b) which ended @ 1.05398. it was then followed by wave c rally to the last high of 1.12000. This a-b-c structure is meant to be wave (4) of a bigger time frame count, and Ideally market will resume its falling momentum for wave 5.
a lower timeframe check at the wave (a) subdivisions. We found a 5 wave impulse structure . Wave (c) also consists of subdivisions of wave 1, 2 , 3, 4. We expect a further tilt upside to form wave 5 before it resumes the bearish outlook in the near term.
a lower timeframe check at the wave (a) subdivisions. We found a 5 wave impulse structure . Wave (c) also consists of subdivisions of wave 1, 2 , 3, 4. We expect a further tilt upside to form wave 5 before it resumes the bearish outlook in the near term.

Thông báo miễn trừ trách nhiệm
Thông tin và các ấn phẩm này không nhằm mục đích, và không cấu thành, lời khuyên hoặc khuyến nghị về tài chính, đầu tư, giao dịch hay các loại khác do TradingView cung cấp hoặc xác nhận. Đọc thêm tại Điều khoản Sử dụng.
Thông báo miễn trừ trách nhiệm
Thông tin và các ấn phẩm này không nhằm mục đích, và không cấu thành, lời khuyên hoặc khuyến nghị về tài chính, đầu tư, giao dịch hay các loại khác do TradingView cung cấp hoặc xác nhận. Đọc thêm tại Điều khoản Sử dụng.