
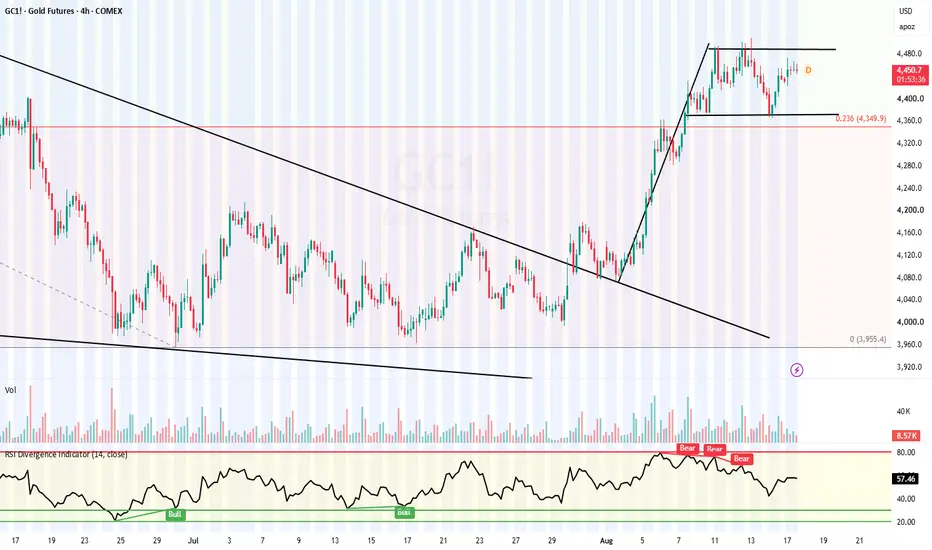
GOLD COMEX TECHNICAL ANALYSIS: BULLISH FLAG PATTERN | $4,370 SUPPORT & $4,490 BREAKOUT
GOLD COMEX — SHORT-TERM TECHNICAL VIEW
After the breakout from the Falling Wedge Pattern, Gold COMEX Futures witnessed a strong upward rally.
As discussed in our previous analysis, the 0.236 Fibonacci retracement level around $4,350 acted as an important support zone.
Previous Analysis:

CURRENT SETUP — 17 AUGUST 2026
On the 4-Hour Chart, Gold COMEX has formed a Bullish Flag Pattern following the sharp rally after the Falling Wedge breakout.
The current consolidation range is:
Flag Support: $4,370
Flag Resistance: $4,490
Any sustained 1-Hour candle close above $4,490 could confirm a bullish breakout and potentially trigger the next upward move.
TWO TRADING STRATEGIES
1. SWING TRADING STRATEGY
Look for buying opportunities around the $4,370 support zone.
Stop Loss: Below $4,340
2. BREAKOUT TRADING STRATEGY
Buy only after a confirmed breakout above $4,490.
Stop Loss: $4,465
For breakout trades, traders should preferably confirm the breakout candle on both the 15-Minute and 1-Hour Charts before entering the trade.
KEY LEVELS TO WATCH
$4,370 — Flag Support
$4,490 — Breakout Resistance
$4,340 — Swing Trade Stop Loss
$4,465 — Breakout Trade Stop Loss
SHORT-TERM VIEW:
The overall short-term structure remains BULLISH as long as Gold holds the key support zone.
Trade with proper risk management and wait for confirmation before entering breakout trades.
#Gold #GoldCOMEX #GoldFutures #GoldTrading #GoldTechnicalAnalysis #GoldAnalysis #GoldPrice #TechnicalAnalysis #BullishFlag #BreakoutTrading #CommodityTrading
GOLD COMEX — SHORT-TERM TECHNICAL VIEW
After the breakout from the Falling Wedge Pattern, Gold COMEX Futures witnessed a strong upward rally.
As discussed in our previous analysis, the 0.236 Fibonacci retracement level around $4,350 acted as an important support zone.
Previous Analysis:
CURRENT SETUP — 17 AUGUST 2026
On the 4-Hour Chart, Gold COMEX has formed a Bullish Flag Pattern following the sharp rally after the Falling Wedge breakout.
The current consolidation range is:
Flag Support: $4,370
Flag Resistance: $4,490
Any sustained 1-Hour candle close above $4,490 could confirm a bullish breakout and potentially trigger the next upward move.
TWO TRADING STRATEGIES
1. SWING TRADING STRATEGY
Look for buying opportunities around the $4,370 support zone.
Stop Loss: Below $4,340
2. BREAKOUT TRADING STRATEGY
Buy only after a confirmed breakout above $4,490.
Stop Loss: $4,465
For breakout trades, traders should preferably confirm the breakout candle on both the 15-Minute and 1-Hour Charts before entering the trade.
KEY LEVELS TO WATCH
$4,370 — Flag Support
$4,490 — Breakout Resistance
$4,340 — Swing Trade Stop Loss
$4,465 — Breakout Trade Stop Loss
SHORT-TERM VIEW:
The overall short-term structure remains BULLISH as long as Gold holds the key support zone.
Trade with proper risk management and wait for confirmation before entering breakout trades.
#Gold #GoldCOMEX #GoldFutures #GoldTrading #GoldTechnicalAnalysis #GoldAnalysis #GoldPrice #TechnicalAnalysis #BullishFlag #BreakoutTrading #CommodityTrading

Bài đăng liên quan
Thông báo miễn trừ trách nhiệm
Thông tin và các ấn phẩm này không nhằm mục đích, và không cấu thành, lời khuyên hoặc khuyến nghị về tài chính, đầu tư, giao dịch hay các loại khác do TradingView cung cấp hoặc xác nhận. Đọc thêm tại Điều khoản Sử dụng.
Bài đăng liên quan
Thông báo miễn trừ trách nhiệm
Thông tin và các ấn phẩm này không nhằm mục đích, và không cấu thành, lời khuyên hoặc khuyến nghị về tài chính, đầu tư, giao dịch hay các loại khác do TradingView cung cấp hoặc xác nhận. Đọc thêm tại Điều khoản Sử dụng.