
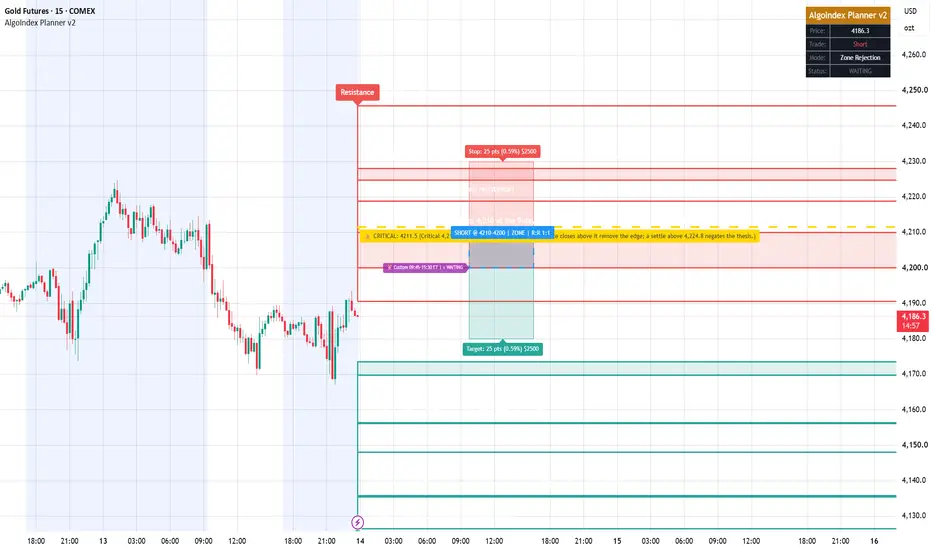
Bias: The December gold contract settled Tuesday at 4,177.3, down 13.3 points or 0.32 percent. The session traded between 4,224.8 and 4,169.7, a 55.1 point daily range with a lower high and a lower low against Monday. The settle finished 13.8 percent of the way up from the low, the second consecutive lower settle and the lowest settle since 10/08. Those extremes are the completed-session inputs behind the published pivot ladder, and they match the chart's daily bar. Gold fell on a day the dollar index closed at 102.18, down 0.41, and the ten-year yield index eased to 5.22 percent. Provider commentary said the dollar was pressured by Federal Reserve comments it described as dovish. A Federal Reserve bank president said at 2:05 PM ET, per the news feed, that one more rate increase may be appropriate this year. December silver fell 1.63 percent to 59.525, lifting the gold-to-silver ratio to 70.18. The news feed carried at 3:04 PM ET to 3:08 PM ET maritime reports of a container vessel and a tanker struck in Hormuz. The settle sits beneath the 20-day through 200-day settlement averages and negative direction leads on the 9-day and 14-day directional systems. The composite snapshot reads "64% SELL" with current strength "Weak" and current direction "Strengthening", against "48% SELL" yesterday, "72% SELL" last week and "24% SELL" last month. In this review's interpretation the bias is lower while the contract holds beneath the 4,200 to 4,211.5 resistance band, with the September consumer price index at 8:30 AM ET on Wednesday, per the verified forward calendar, able to move the dollar and yields sharply in either direction.
Resistance:
- 4,266.6 Pivot R3
- 4,245.7 Pivot R2
- 4,228.1 three standard deviations resistance
- 4,224.9 18-day average crossing price for Wednesday
- 4,224.8 Tuesday's session high
- 4,218.8 two standard deviations resistance
- 4,211.5 Pivot R1
- 4,206.6 one standard deviation resistance
- 4,202.3 9-day average stall level
- 4,190.6 Pivot Point
Support:
- 4,173.5 9-day average crossing price for Wednesday
- 4,169.7 Tuesday's session low
- 4,156.4 Pivot S1
- 4,156.1 Friday's session low
- 4,148.0 one standard deviation support
- 4,135.8 two standard deviations support
- 4,135.5 Pivot S2
- 4,126.5 three standard deviations support
- 4,101.3 Pivot S3
- 4,091.2 one-month low
Primary Setup: SHORT December gold from a rally into the 4,200 to 4,210 band around the 9-day average stall level at 4,202.3 and one standard deviation resistance at 4,206.6, beneath Pivot R1 at 4,211.5. Stop 4,230 above Tuesday's 4,224.8 high and three standard deviations resistance at 4,228.1. Targets at 4,180 first, just above Tuesday's settle, 4,155 second, just beneath Pivot S1 at 4,156.4, and 4,130 third, just above three standard deviations support at 4,126.5. Risk to reward is roughly 1:1 to the first objective, 1:2 to the second and 1:3 to the third from the entry midpoint. The 14-day average true range is 84.9 points against a 25 point stop distance. A settle above 4,224.8 negates the thesis; two consecutive 30-minute closes above Pivot R1 at 4,211.5 remove the edge before the stop is reached. The settle sits beneath the entry band, so the setup needs a rally to engage. A soft inflation print or a Gulf escalation is the main risk to a short, which makes this an analyst judgment that the downtrend resumes from a rally.
The 4,177.3 settle sits at 13.8 percent of a range that set a lower high and a lower low. In this review's interpretation Wednesday is a test of whether the 4,200 to 4,211.5 band caps a rally, with Pivot S1 at 4,156.4 the line between a pullback and a test of the 4,091.2 one-month low.
Resistance:
- 4,266.6 Pivot R3
- 4,245.7 Pivot R2
- 4,228.1 three standard deviations resistance
- 4,224.9 18-day average crossing price for Wednesday
- 4,224.8 Tuesday's session high
- 4,218.8 two standard deviations resistance
- 4,211.5 Pivot R1
- 4,206.6 one standard deviation resistance
- 4,202.3 9-day average stall level
- 4,190.6 Pivot Point
Support:
- 4,173.5 9-day average crossing price for Wednesday
- 4,169.7 Tuesday's session low
- 4,156.4 Pivot S1
- 4,156.1 Friday's session low
- 4,148.0 one standard deviation support
- 4,135.8 two standard deviations support
- 4,135.5 Pivot S2
- 4,126.5 three standard deviations support
- 4,101.3 Pivot S3
- 4,091.2 one-month low
Primary Setup: SHORT December gold from a rally into the 4,200 to 4,210 band around the 9-day average stall level at 4,202.3 and one standard deviation resistance at 4,206.6, beneath Pivot R1 at 4,211.5. Stop 4,230 above Tuesday's 4,224.8 high and three standard deviations resistance at 4,228.1. Targets at 4,180 first, just above Tuesday's settle, 4,155 second, just beneath Pivot S1 at 4,156.4, and 4,130 third, just above three standard deviations support at 4,126.5. Risk to reward is roughly 1:1 to the first objective, 1:2 to the second and 1:3 to the third from the entry midpoint. The 14-day average true range is 84.9 points against a 25 point stop distance. A settle above 4,224.8 negates the thesis; two consecutive 30-minute closes above Pivot R1 at 4,211.5 remove the edge before the stop is reached. The settle sits beneath the entry band, so the setup needs a rally to engage. A soft inflation print or a Gulf escalation is the main risk to a short, which makes this an analyst judgment that the downtrend resumes from a rally.
The 4,177.3 settle sits at 13.8 percent of a range that set a lower high and a lower low. In this review's interpretation Wednesday is a test of whether the 4,200 to 4,211.5 band caps a rally, with Pivot S1 at 4,156.4 the line between a pullback and a test of the 4,091.2 one-month low.

Full analysis built on professional-grade market data and our own analysis: algoindex.com/blog. Verify the record with 220+ outcomes published before the session and graded after the close, plus free tools: algoindex.com/tools
Thông báo miễn trừ trách nhiệm
Thông tin và các ấn phẩm này không nhằm mục đích, và không cấu thành, lời khuyên hoặc khuyến nghị về tài chính, đầu tư, giao dịch hay các loại khác do TradingView cung cấp hoặc xác nhận. Đọc thêm tại Điều khoản Sử dụng.
Full analysis built on professional-grade market data and our own analysis: algoindex.com/blog. Verify the record with 220+ outcomes published before the session and graded after the close, plus free tools: algoindex.com/tools
Thông báo miễn trừ trách nhiệm
Thông tin và các ấn phẩm này không nhằm mục đích, và không cấu thành, lời khuyên hoặc khuyến nghị về tài chính, đầu tư, giao dịch hay các loại khác do TradingView cung cấp hoặc xác nhận. Đọc thêm tại Điều khoản Sử dụng.