
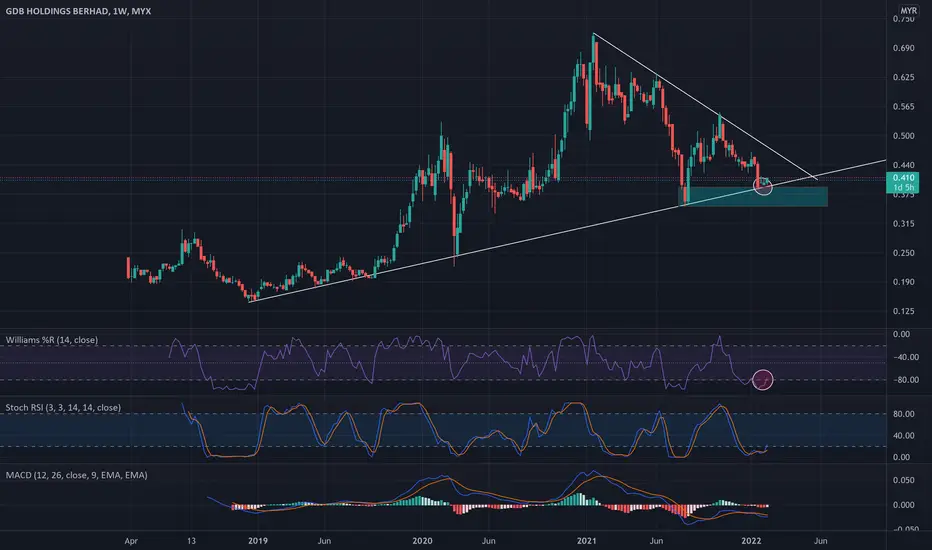
Trend:-
The chart shows a beautiful uptrend for a long term and downtrend for mid term.
According to indicator:-
William r shows that the price has started to turning up and already past -80 line indicated that the price will go up
Stochastic also show that the line has past line 20 and blue line has cross the orange line. Furthermore, the line also has touch line 20 which indicated that price will go up.
As for fundamental:-
This company has low debt
Has a low Earnings Before Interest Tax but never negative in past year
Show a grow in asset every year indicated that the company is growing
you can see it yourself, if you don't believe me
Investment strategy:-
take long term long
take a mid term long

Thông báo miễn trừ trách nhiệm
Thông tin và các ấn phẩm này không nhằm mục đích, và không cấu thành, lời khuyên hoặc khuyến nghị về tài chính, đầu tư, giao dịch hay các loại khác do TradingView cung cấp hoặc xác nhận. Đọc thêm tại Điều khoản Sử dụng.
Thông báo miễn trừ trách nhiệm
Thông tin và các ấn phẩm này không nhằm mục đích, và không cấu thành, lời khuyên hoặc khuyến nghị về tài chính, đầu tư, giao dịch hay các loại khác do TradingView cung cấp hoặc xác nhận. Đọc thêm tại Điều khoản Sử dụng.