
Upside:
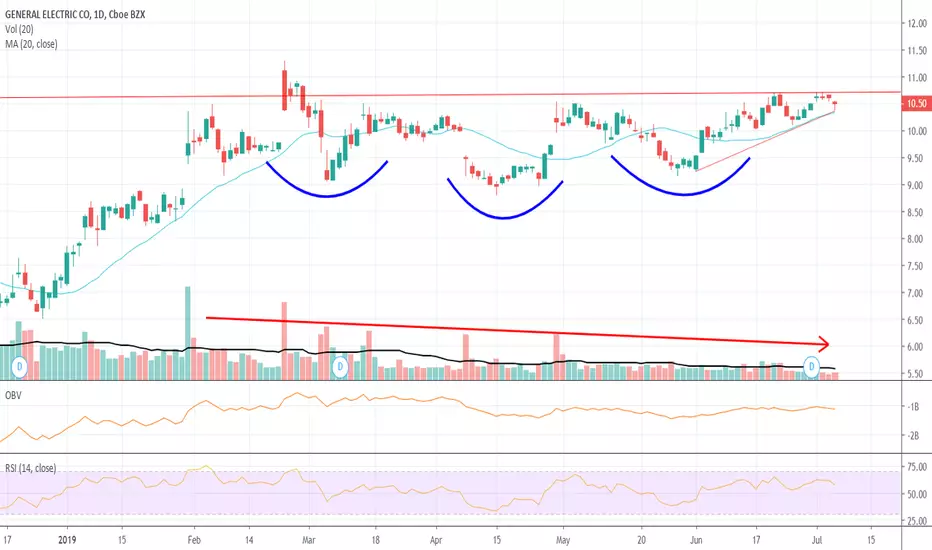
- Ascending triangle forming over the past month
- The bottom of the ascending triangle is closely in-line with the 20-day SMA, providing additional support
- Inverse head and shoulders set-up forming since early February
Downside:
- Stock price has failed to break above $10.71-$10.72 on three separate days, potentially leading to a double-top set-up
- Volume has slowly been trending down
Notable Prices:
- Top of ascending triangle (also potential double top level) is $10.72
- Bottom of triangle and 2-day SMA is $10.35
I am watching to see which way out of this narrow range the stock price breaks and the volume that is associated with it.
- Ascending triangle forming over the past month
- The bottom of the ascending triangle is closely in-line with the 20-day SMA, providing additional support
- Inverse head and shoulders set-up forming since early February
Downside:
- Stock price has failed to break above $10.71-$10.72 on three separate days, potentially leading to a double-top set-up
- Volume has slowly been trending down
Notable Prices:
- Top of ascending triangle (also potential double top level) is $10.72
- Bottom of triangle and 2-day SMA is $10.35
I am watching to see which way out of this narrow range the stock price breaks and the volume that is associated with it.

Thông báo miễn trừ trách nhiệm
Thông tin và các ấn phẩm này không nhằm mục đích, và không cấu thành, lời khuyên hoặc khuyến nghị về tài chính, đầu tư, giao dịch hay các loại khác do TradingView cung cấp hoặc xác nhận. Đọc thêm tại Điều khoản Sử dụng.
Thông báo miễn trừ trách nhiệm
Thông tin và các ấn phẩm này không nhằm mục đích, và không cấu thành, lời khuyên hoặc khuyến nghị về tài chính, đầu tư, giao dịch hay các loại khác do TradingView cung cấp hoặc xác nhận. Đọc thêm tại Điều khoản Sử dụng.