Giá xuống
Ger30 Short
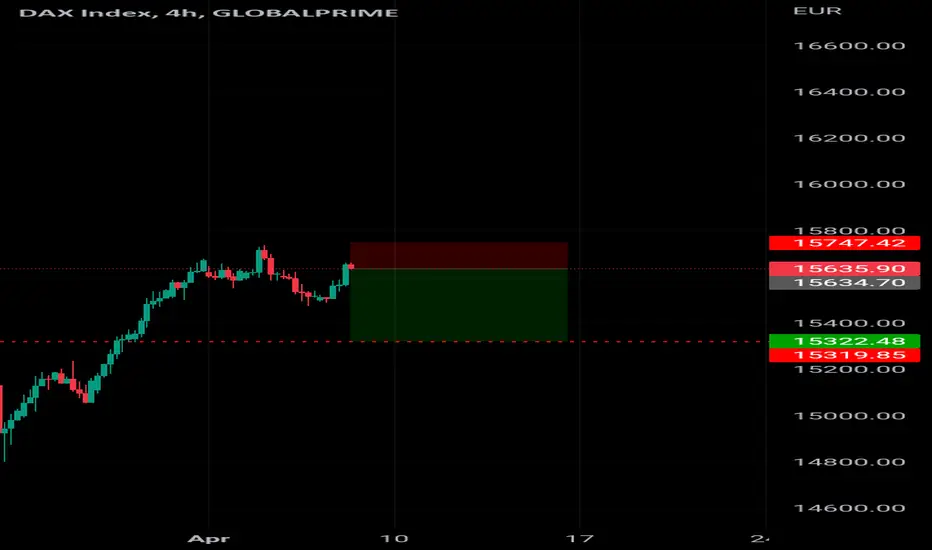
Ger30 Short potential
Short it now
The GER30 daily chart is trading in its bullish channel between its upper blue and red bands. It RSI is trading above 50 (green rectangle). The longer it maintains on the bullish side of 50 the greater the probability of higher prices ahead.
The hourly chart shows a strong start to today's trade. The trend following EMAs and the momentum-based stochastic have turned up (black ellipses). If the stochastic makes its way to the 80+ levels (blue arrow) and holds it will denote a strong underlying bullish momentum is present.

Thông báo miễn trừ trách nhiệm
Thông tin và các ấn phẩm này không nhằm mục đích, và không cấu thành, lời khuyên hoặc khuyến nghị về tài chính, đầu tư, giao dịch hay các loại khác do TradingView cung cấp hoặc xác nhận. Đọc thêm tại Điều khoản Sử dụng.
Thông báo miễn trừ trách nhiệm
Thông tin và các ấn phẩm này không nhằm mục đích, và không cấu thành, lời khuyên hoặc khuyến nghị về tài chính, đầu tư, giao dịch hay các loại khác do TradingView cung cấp hoặc xác nhận. Đọc thêm tại Điều khoản Sử dụng.