
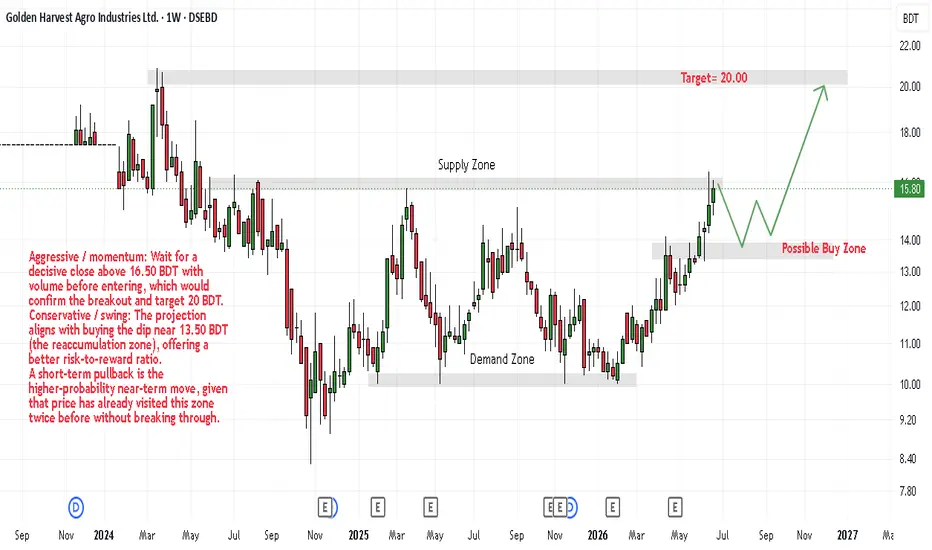
Late 2023 – Early 2024: The stock rallied sharply from the ~10 BDT demand zone up toward the ~16–16.50 BDT supply zone — a strong move of roughly 60%.
2024 – Mid-2025: The stock traded in a broad range, oscillating between those two levels, with multiple rejections at the 16 BDT area and bounces off the 10 BDT zone.
Late 2025 – Early 2026: Another strong rally broke through the 16 BDT resistance, surging toward the 20 BDT supply zone — but was rejected there, sending price back down.
Current (June 2026): Price is once again approaching the 16–16.50 BDT supply zone from below, sitting at 15.80 BDT.
The Projection (Green Arrow Overlay)
The chart's overlay suggests the following forward path:
Step 1 — Rejection: Price fails to break the 16–16.50 BDT zone and pulls back to around 13.50 BDT.
Step 2 — Reaccumulation: The dip finds support and holds.
Step 3 — Breakout rally: A sustained bullish move drives the stock up through both supply zones, targeting the 20 BDT area.
My Technical Assessment
The stock is at a critical decision point. Here's what to watch:
Bullish Case
The 10 BDT demand zone has proven reliable support over multiple years.
Each rally from that zone has pushed higher, with the most recent one reaching 20 BDT.
If the 16–16.50 BDT zone breaks with volume, the path to 20 BDT is relatively clear.
The multi-year trend structure shows higher highs and higher lows — textbook uptrend.
Bearish Concerns
The current price (15.80 BDT) is right at the lower supply zone — a known rejection area.
The prior attempt at 20 BDT was firmly rejected, suggesting strong selling pressure up there.
The projected dip to 13.50 BDT implies ~15% downside from current levels in the near term.
Verdict
This is a range-play setup near the top of the range. The most prudent approach depends on your strategy:
Aggressive / momentum: Wait for a decisive close above 16.50 BDT with volume before entering, which would confirm the breakout and target 20 BDT.
Conservative / swing: The projection aligns with buying the dip near 13.50 BDT (the reaccumulation zone), offering a better risk-to-reward ratio.
A short-term pullback is the higher-probability near-term move, given that price has already visited this zone twice before without breaking through.
Keep an eye on earnings reports (the "E" markers on the timeline) as those have historically coincided with volatility around these turning points.

Thông báo miễn trừ trách nhiệm
Thông tin và các ấn phẩm này không nhằm mục đích, và không cấu thành, lời khuyên hoặc khuyến nghị về tài chính, đầu tư, giao dịch hay các loại khác do TradingView cung cấp hoặc xác nhận. Đọc thêm tại Điều khoản Sử dụng.
Thông báo miễn trừ trách nhiệm
Thông tin và các ấn phẩm này không nhằm mục đích, và không cấu thành, lời khuyên hoặc khuyến nghị về tài chính, đầu tư, giao dịch hay các loại khác do TradingView cung cấp hoặc xác nhận. Đọc thêm tại Điều khoản Sử dụng.