
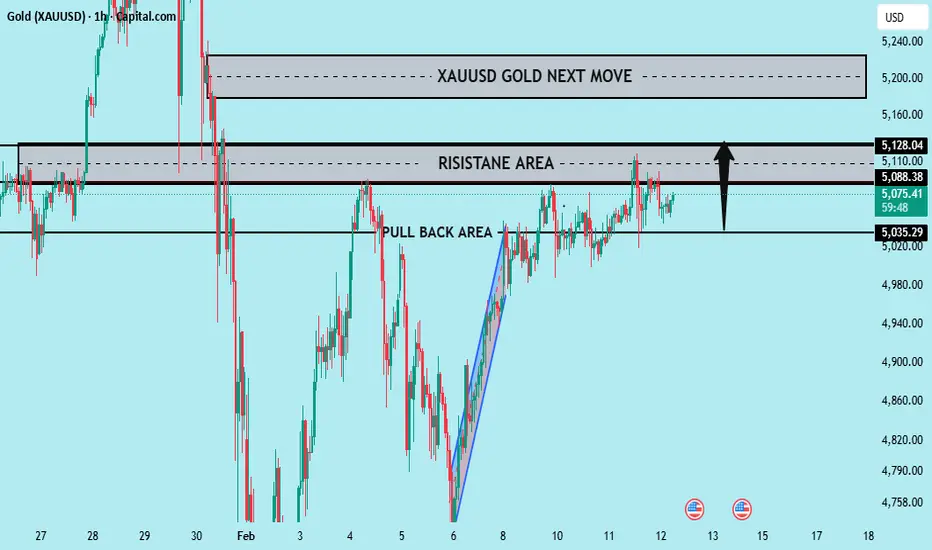
Gold is currently trading inside a compression structure below a major resistance zone, after a strong impulsive bullish expansion. The H1 chart is showing a classic accumulation → breakout attempt → decision phase.
Let’s break the full market mind step-by-step:
🔎 1️⃣ Market Structure (H1)
Strong bullish impulse created higher highs & higher lows.
Price entered a supply / resistance zone (5085 – 5128 area).
Now forming tight consolidation under resistance.
Volatility is decreasing → indicates energy building phase.
Structure is still technically bullish because higher lows are intact.
🧠 2️⃣ Smart Money Perspective
What is happening psychologically?
Retail buyers are entering on breakout anticipation.
Sellers are defending resistance.
Liquidity is resting:
Above recent highs (buy stops)
Below consolidation lows (sell stops)
Market likely wants to grab liquidity before real expansion.
🔴 3️⃣ Resistance Zone: 5085 – 5128
This is the decision zone.
If price:
Rejects strongly → fake breakout scenario.
Closes strong H1 candle above 5128 → continuation rally.
This area is heavy supply. Without strong volume, breakout may fail.
🟢 4️⃣ Bullish Scenario (Break & Hold)
Condition:
Clean H1 close above 5128
Followed by retest holding above 5085
Targets:
5160 (intraday resistance)
5200 (psychological level)
5240 – 5260 expansion zone
Bias shifts strongly bullish after confirmed breakout.
🔻 5️⃣ Bearish Scenario (Rejection & Sweep)
Condition:
Strong rejection wick
Bearish engulfing on H1
Break below consolidation low (around 5035)
Targets:
5013 demand
4980 liquidity pool
4940 if momentum increases
Break of 5035 = short-term structure shift bearish.

Thông báo miễn trừ trách nhiệm
Thông tin và các ấn phẩm này không nhằm mục đích, và không cấu thành, lời khuyên hoặc khuyến nghị về tài chính, đầu tư, giao dịch hay các loại khác do TradingView cung cấp hoặc xác nhận. Đọc thêm tại Điều khoản Sử dụng.
Thông báo miễn trừ trách nhiệm
Thông tin và các ấn phẩm này không nhằm mục đích, và không cấu thành, lời khuyên hoặc khuyến nghị về tài chính, đầu tư, giao dịch hay các loại khác do TradingView cung cấp hoặc xác nhận. Đọc thêm tại Điều khoản Sử dụng.