
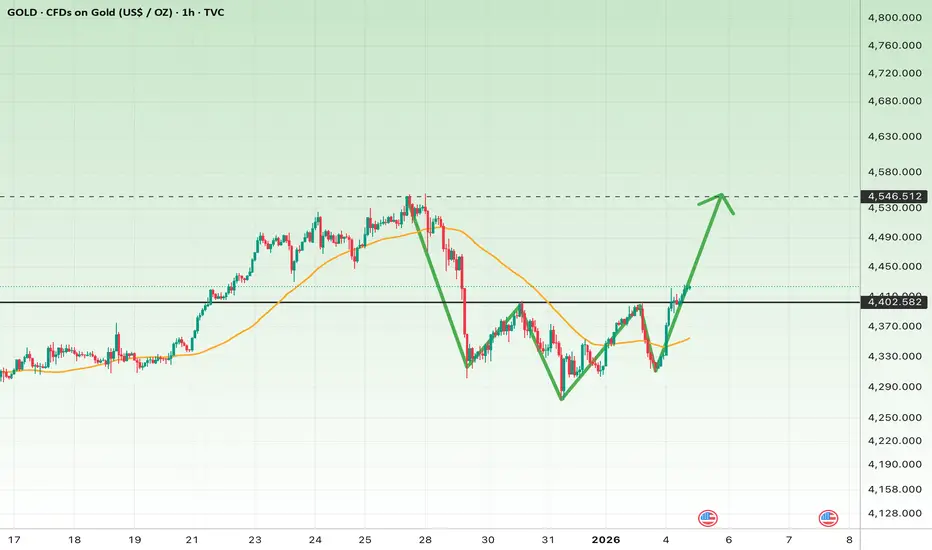
Gold is currently in a short-term recovery phase following a sharp sell-off. Price has reclaimed the moving average and is now testing a major horizontal resistance zone around 4400–4410.
This area represents a high-probability decision zone.
Key observations:
• V-shaped recovery after impulsive drop
• Price above the moving average
• Direct interaction with a key resistance level
Key Levels
• Major Support:
4320 – 4340
• Immediate Resistance:
4400 – 4420
• Next Major Resistance:
4540 – 4550
Bullish Scenario (Continuation)
If price:
• Holds above 4400
• Shows acceptance with strong hourly closes
Then bullish continuation becomes the dominant scenario.
Upside Targets:
4420 → 4480 → 4540
Bullish Invalidation:
Hourly close below 4360
Bearish Scenario (Rejection)
If price:
• Fails to break and hold above 4400
• Loses the moving average again
This would indicate a pullback into resistance or a liquidity grab.
Downside Targets:
4350 → 4300
Bearish Invalidation:
Strong hourly close above 4420
Final Takeaway
This is a confirmation zone, not a prediction zone.
Acceptance above resistance favors continuation, rejection favors a controlled pullback.
This area represents a high-probability decision zone.
Key observations:
• V-shaped recovery after impulsive drop
• Price above the moving average
• Direct interaction with a key resistance level
Key Levels
• Major Support:
4320 – 4340
• Immediate Resistance:
4400 – 4420
• Next Major Resistance:
4540 – 4550
Bullish Scenario (Continuation)
If price:
• Holds above 4400
• Shows acceptance with strong hourly closes
Then bullish continuation becomes the dominant scenario.
Upside Targets:
4420 → 4480 → 4540
Bullish Invalidation:
Hourly close below 4360
Bearish Scenario (Rejection)
If price:
• Fails to break and hold above 4400
• Loses the moving average again
This would indicate a pullback into resistance or a liquidity grab.
Downside Targets:
4350 → 4300
Bearish Invalidation:
Strong hourly close above 4420
Final Takeaway
This is a confirmation zone, not a prediction zone.
Acceptance above resistance favors continuation, rejection favors a controlled pullback.

Thông báo miễn trừ trách nhiệm
Thông tin và các ấn phẩm này không nhằm mục đích, và không cấu thành, lời khuyên hoặc khuyến nghị về tài chính, đầu tư, giao dịch hay các loại khác do TradingView cung cấp hoặc xác nhận. Đọc thêm tại Điều khoản Sử dụng.
Thông báo miễn trừ trách nhiệm
Thông tin và các ấn phẩm này không nhằm mục đích, và không cấu thành, lời khuyên hoặc khuyến nghị về tài chính, đầu tư, giao dịch hay các loại khác do TradingView cung cấp hoặc xác nhận. Đọc thêm tại Điều khoản Sử dụng.