
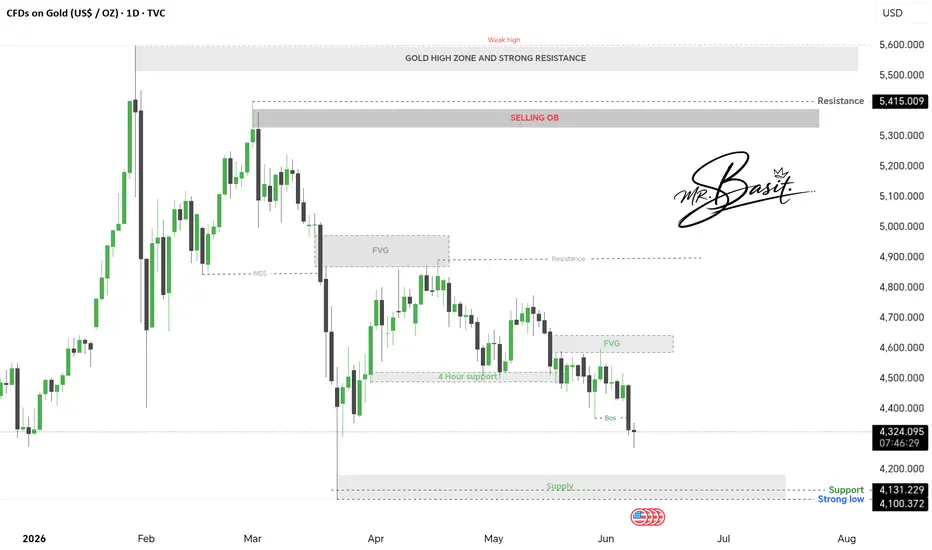
Technical Analysis (SMC & ICT Approach)
Looking at the 4-Hour timeframe, Gold has delivered a textbook institutional setup, sweeping critical liquidity pools before stabilizing at a key institutional demand zone.
Liquidity Hunt & Sweep: The price recently took out internal sell-side liquidity (SSL), trapping early sellers and clearing out weak long stops. This aggressive sweep indicates institutional accumulation.
Order Block Validation: Following the sweep, the price precisely mitigated a well-defined 4H Bullish Order Block (OB). The immediate rejection and strong buying wick confirm institutional presence at these discount levels.
Market Structure Shift (MSS): The lower timeframe confirmation shows an immediate displacement upside, suggesting that the order flow is shifting back in favor of the bulls.
Key Levels to Watch:
Immediate Support: The immediate mitigation zone of the 4H Order Block.
Upside Targets: The clean highs and Fair Value Gaps (FVG) left above during the recent descent will act as natural magnets for price.
🌍 Fundamental Overview
The technical setup aligns perfectly with the current macroeconomic backdrop, which continues to support Gold's structural bull run:
Fed Policy & Interest Rate Sentiment: Recent economic data continues to fuel speculation around the Federal Reserve's monetary policy path. Market participants are closely monitoring inflation metrics, keeping the US Dollar (DXY) in a volatile phase, which directly influences Gold's safe-haven appeal.
Institutional Demand & ETF Flows: Despite short-term liquidations, long-term institutional interest and central bank accumulation remain robust, providing a strong floor for any deep corrective pullbacks.
Geopolitical Premium: Ongoing global geopolitical tensions maintain a consistent risk premium in the market, encouraging investors to treat Gold as the ultimate store of value during times of uncertainty.
Trade Idea & Risk Management
Disclaimer: This analysis is for educational purposes only and does not constitute financial advice. Always practice strict risk management.
Bias: Bullish above the 4H Order Block invalidation level.
Execution: Looking for continuation plays on lower timeframes (15m/5m) inside the current demand zone.
Risk Management: Protect your capital. A clean break and body close below the structural invalidation point invalidates this institutional long setup.
What are your thoughts on Gold's next major move? Do you think the DXY will allow a full trend continuation? Let me know in the comments below!

This analysis reflects the state of the XAUUSD daily chart one month ago, highlighting a clear structural shift and Change of Character. It captures the market's evolution from a key discount zone to its current market environment.
This post is a structured educational case study demonstrating how we utilized the Daily (1D) timeframe precisely one month ago to map out institutional order flow before the recent market expansion took place.
By cutting the price action back using the replay tool, we can clearly isolate how smart money positions itself at major discount levels before executing massive trend continuations.
📊 Technical & Structural Breakdown (SMC/ICT)
1. The Change of Character (CHoCH)
Before this setup matured, Gold was experiencing a corrective phase. The structure completely flipped when price delivered a aggressive Change of Character (CHoCH) to the upside. This massive displacement proved that institutional market participants were stepping in to shift the long-term order flow from bearish to bullish.
2. Premium vs. Discount Pricing
Following a CHoCH, smart money never chases high prices. We waited patiently for a deep retracement into the Discount Zone, specifically targeting the institutional Daily Demand Zone / Bullish Order Block highlighted on the chart.
3. Mitigation & Liquidity Engineering
Mitigation: The price returned perfectly to tap the open contracts sitting inside the Daily Order Block. This retest cleared remaining sell orders, balancing the price action.
Liquidity Targets: The relatively equal highs and clean swing points resting above host significant Buy-Side Liquidity (BSL). These levels act as magnets for institutional profit-taking.
🌍 Macroeconomic & Fundamental Confluence
To get an Editor's Pick, your technical narrative must align with the global macro landscape. One month ago, the fundamental pillars supporting this daily demand zone included:
Monetary Policy Shifts: Shifting sentiments surrounding the Federal Reserve's interest rate trajectory and inflationary cycles kept the US Dollar (DXY) volatile, naturally driving capital into Gold's structural bull market.
Safe-Haven Premium: Rising global geopolitical tensions and steady central bank accumulation created a rock-solid floor under Gold, ensuring that major daily demand blocks attracted aggressive institutional buying.
💡 Educational Takeaway for the Community
🧠 Trading Lesson: Lower timeframes (15m/5m) are excellent for execution, but Higher Timeframes (1D/4H) rule the market narrative. When you find a Daily Demand Block backed by a structural CHoCH and strong fundamentals, your probability of success skyrockets. Patience in letting the market come to your zone is what separates professional traders from retail chasers.
How do you utilize Bar Replay to backtest your SMC strategies? Do you see Gold taking out the ultimate Buy-Side Liquidity pools next? Let's discuss below!

Educational Case Study: Inter-Market Correlation — Decoding the Synchronized Drops in BTCUSD & Gold
📌 Introduction to Cross-Asset Liquidity Flows
As professional traders, we cannot analyze assets in isolation. The global financial ecosystem is deeply interconnected. Today’s educational post breaks down the recent 4-Hour BTCUSD structural breakdown and explores its profound inter-market correlation with Gold (XAUUSD) and Silver (XAGUSD).
When institutional players shift their asset allocations due to macroeconomic triggers, we often witness synchronized liquidations across both digital gold (Bitcoin) and physical precious metals.
📊 BTCUSD Technical & SMC Breakdown (4H Timeframe)
Looking closely at the Bitcoin chart, the market structure delivered a textbook institutional distribution and stop-hunt sequence before the aggressive sell-off occurred:
Liquidity Sweep at Key Resistance: Bitcoin rallied into a major descending trendline and historical resistance zone. This move engineered buy-side liquidity (BSL), trapping early breakout buyers who thought the asset was going to the moon.
Institutional Rejection: Once the liquidity was swept, aggressive institutional selling entered the market, leaving behind a clear bearish footprint and forcing a breakdown below key structural support.
The Domino Effect: This structural breakdown triggered a cascade of long liquidations, forcing the price to dump rapidly into lower structural discount zones.
🧠 The Educational Secret: Why Do BTC, Gold, & Silver Drop Together?
Retail traders are often confused when they see Bitcoin (a risk asset) and Gold (a safe-haven asset) crash at the exact same time. Here is the institutional reality behind this correlation:
1. The Global Dollar (DXY) Effect
When macroeconomic data causes a sudden, aggressive spike in the US Dollar Index (DXY) or Treasury yields, all dollar-denominated assets automatically face heavy pressure. Because BTC, XAU, and XAG are all priced against the USD, a dominant Dollar crushes them simultaneously.
2. Institutional Risk-Off & Deleveraging
In modern financial markets, major hedge funds and institutions trade both crypto and commodities under the same portfolio umbrellas. When macro uncertainty hits, or when margin calls happen in one sector, institutions actively liquidate winning positions across both Bitcoin and Gold to raise raw cash liquidity.
3. Silver & Gold Synchronicity
Silver historically moves as a high-beta version of Gold. When institutional order flow flips bearish on Gold's higher timeframes, Silver amplifies that move, dumping with even higher velocity alongside the crypto markets.
🌍 Current Fundamental Factors
Institutional Fund Outflows: Recent streaks of institutional ETF outflows across major crypto funds have temporarily reduced the aggressive buying pressure, allowing the technical bearish structure to play out fully.
Macro Uncertainty: Shifting macroeconomic timelines regarding central bank interest rate decisions have caused massive profit-taking cycles across the entire financial spectrum—hitting BTC, Gold, and Silver back-to-back.
💡 Key Takeaways for Developing Traders
Check the Bigger Picture: Before entering a trade on Bitcoin, always take a look at Gold, Silver, and the DXY. If you see a synchronized breakdown happening across metals, it heavily increases the probability of your BTC short setup playing out.
Beware of the Trendline Trap: Trendlines are liquidity pools. Institutions love pushing prices just above a visible trendline to grab stops before reversing the market aggressively.
Did you spot this synchronized liquidation across Crypto and Metals before it happened? Where do you see BTC stabilizing next? Let me know your thoughts in the comments below!
Looking at the 4-Hour timeframe, Gold has delivered a textbook institutional setup, sweeping critical liquidity pools before stabilizing at a key institutional demand zone.
Liquidity Hunt & Sweep: The price recently took out internal sell-side liquidity (SSL), trapping early sellers and clearing out weak long stops. This aggressive sweep indicates institutional accumulation.
Order Block Validation: Following the sweep, the price precisely mitigated a well-defined 4H Bullish Order Block (OB). The immediate rejection and strong buying wick confirm institutional presence at these discount levels.
Market Structure Shift (MSS): The lower timeframe confirmation shows an immediate displacement upside, suggesting that the order flow is shifting back in favor of the bulls.
Key Levels to Watch:
Immediate Support: The immediate mitigation zone of the 4H Order Block.
Upside Targets: The clean highs and Fair Value Gaps (FVG) left above during the recent descent will act as natural magnets for price.
🌍 Fundamental Overview
The technical setup aligns perfectly with the current macroeconomic backdrop, which continues to support Gold's structural bull run:
Fed Policy & Interest Rate Sentiment: Recent economic data continues to fuel speculation around the Federal Reserve's monetary policy path. Market participants are closely monitoring inflation metrics, keeping the US Dollar (DXY) in a volatile phase, which directly influences Gold's safe-haven appeal.
Institutional Demand & ETF Flows: Despite short-term liquidations, long-term institutional interest and central bank accumulation remain robust, providing a strong floor for any deep corrective pullbacks.
Geopolitical Premium: Ongoing global geopolitical tensions maintain a consistent risk premium in the market, encouraging investors to treat Gold as the ultimate store of value during times of uncertainty.
Trade Idea & Risk Management
Disclaimer: This analysis is for educational purposes only and does not constitute financial advice. Always practice strict risk management.
Bias: Bullish above the 4H Order Block invalidation level.
Execution: Looking for continuation plays on lower timeframes (15m/5m) inside the current demand zone.
Risk Management: Protect your capital. A clean break and body close below the structural invalidation point invalidates this institutional long setup.
What are your thoughts on Gold's next major move? Do you think the DXY will allow a full trend continuation? Let me know in the comments below!
This analysis reflects the state of the XAUUSD daily chart one month ago, highlighting a clear structural shift and Change of Character. It captures the market's evolution from a key discount zone to its current market environment.
This post is a structured educational case study demonstrating how we utilized the Daily (1D) timeframe precisely one month ago to map out institutional order flow before the recent market expansion took place.
By cutting the price action back using the replay tool, we can clearly isolate how smart money positions itself at major discount levels before executing massive trend continuations.
📊 Technical & Structural Breakdown (SMC/ICT)
1. The Change of Character (CHoCH)
Before this setup matured, Gold was experiencing a corrective phase. The structure completely flipped when price delivered a aggressive Change of Character (CHoCH) to the upside. This massive displacement proved that institutional market participants were stepping in to shift the long-term order flow from bearish to bullish.
2. Premium vs. Discount Pricing
Following a CHoCH, smart money never chases high prices. We waited patiently for a deep retracement into the Discount Zone, specifically targeting the institutional Daily Demand Zone / Bullish Order Block highlighted on the chart.
3. Mitigation & Liquidity Engineering
Mitigation: The price returned perfectly to tap the open contracts sitting inside the Daily Order Block. This retest cleared remaining sell orders, balancing the price action.
Liquidity Targets: The relatively equal highs and clean swing points resting above host significant Buy-Side Liquidity (BSL). These levels act as magnets for institutional profit-taking.
🌍 Macroeconomic & Fundamental Confluence
To get an Editor's Pick, your technical narrative must align with the global macro landscape. One month ago, the fundamental pillars supporting this daily demand zone included:
Monetary Policy Shifts: Shifting sentiments surrounding the Federal Reserve's interest rate trajectory and inflationary cycles kept the US Dollar (DXY) volatile, naturally driving capital into Gold's structural bull market.
Safe-Haven Premium: Rising global geopolitical tensions and steady central bank accumulation created a rock-solid floor under Gold, ensuring that major daily demand blocks attracted aggressive institutional buying.
💡 Educational Takeaway for the Community
🧠 Trading Lesson: Lower timeframes (15m/5m) are excellent for execution, but Higher Timeframes (1D/4H) rule the market narrative. When you find a Daily Demand Block backed by a structural CHoCH and strong fundamentals, your probability of success skyrockets. Patience in letting the market come to your zone is what separates professional traders from retail chasers.
How do you utilize Bar Replay to backtest your SMC strategies? Do you see Gold taking out the ultimate Buy-Side Liquidity pools next? Let's discuss below!
Educational Case Study: Inter-Market Correlation — Decoding the Synchronized Drops in BTCUSD & Gold
📌 Introduction to Cross-Asset Liquidity Flows
As professional traders, we cannot analyze assets in isolation. The global financial ecosystem is deeply interconnected. Today’s educational post breaks down the recent 4-Hour BTCUSD structural breakdown and explores its profound inter-market correlation with Gold (XAUUSD) and Silver (XAGUSD).
When institutional players shift their asset allocations due to macroeconomic triggers, we often witness synchronized liquidations across both digital gold (Bitcoin) and physical precious metals.
📊 BTCUSD Technical & SMC Breakdown (4H Timeframe)
Looking closely at the Bitcoin chart, the market structure delivered a textbook institutional distribution and stop-hunt sequence before the aggressive sell-off occurred:
Liquidity Sweep at Key Resistance: Bitcoin rallied into a major descending trendline and historical resistance zone. This move engineered buy-side liquidity (BSL), trapping early breakout buyers who thought the asset was going to the moon.
Institutional Rejection: Once the liquidity was swept, aggressive institutional selling entered the market, leaving behind a clear bearish footprint and forcing a breakdown below key structural support.
The Domino Effect: This structural breakdown triggered a cascade of long liquidations, forcing the price to dump rapidly into lower structural discount zones.
🧠 The Educational Secret: Why Do BTC, Gold, & Silver Drop Together?
Retail traders are often confused when they see Bitcoin (a risk asset) and Gold (a safe-haven asset) crash at the exact same time. Here is the institutional reality behind this correlation:
1. The Global Dollar (DXY) Effect
When macroeconomic data causes a sudden, aggressive spike in the US Dollar Index (DXY) or Treasury yields, all dollar-denominated assets automatically face heavy pressure. Because BTC, XAU, and XAG are all priced against the USD, a dominant Dollar crushes them simultaneously.
2. Institutional Risk-Off & Deleveraging
In modern financial markets, major hedge funds and institutions trade both crypto and commodities under the same portfolio umbrellas. When macro uncertainty hits, or when margin calls happen in one sector, institutions actively liquidate winning positions across both Bitcoin and Gold to raise raw cash liquidity.
3. Silver & Gold Synchronicity
Silver historically moves as a high-beta version of Gold. When institutional order flow flips bearish on Gold's higher timeframes, Silver amplifies that move, dumping with even higher velocity alongside the crypto markets.
🌍 Current Fundamental Factors
Institutional Fund Outflows: Recent streaks of institutional ETF outflows across major crypto funds have temporarily reduced the aggressive buying pressure, allowing the technical bearish structure to play out fully.
Macro Uncertainty: Shifting macroeconomic timelines regarding central bank interest rate decisions have caused massive profit-taking cycles across the entire financial spectrum—hitting BTC, Gold, and Silver back-to-back.
💡 Key Takeaways for Developing Traders
Check the Bigger Picture: Before entering a trade on Bitcoin, always take a look at Gold, Silver, and the DXY. If you see a synchronized breakdown happening across metals, it heavily increases the probability of your BTC short setup playing out.
Beware of the Trendline Trap: Trendlines are liquidity pools. Institutions love pushing prices just above a visible trendline to grab stops before reversing the market aggressively.
Did you spot this synchronized liquidation across Crypto and Metals before it happened? Where do you see BTC stabilizing next? Let me know your thoughts in the comments below!
Ghi chú
We are tracking a highly precise institutional footprint on XAUUSD. When executing higher-timeframe structures, patience is our greatest edge. As seen in the analysis, we wait for the smart money to engineer liquidity and mitigate our premium/discount zones before looking for lower-timeframe confirmations.⚡ Inter-Market Warning: Keep a close eye on the US Dollar Index (DXY) and broader cross-asset liquidity flows. When institutional de-leveraging kicks in, we often see synchronized movements across Gold, Silver, and even Bitcoin. Always trade with strict risk management and let the market come to your zones.
Ghi chú
This daily blueprint captures the market structure exactly as it was framed 1 month ago. It serves as a live educational case study on why we map higher-timeframe demand zones before the expansion happens, rather than chasing green candles.📉 The Liquidity Core: Gold doesn't move in a vacuum. Notice how recent structural shifts aligned directly with liquidations in Bitcoin and Silver. When a systemic risk-off wave hits the global market, big funds pull capital simultaneously across metals and crypto. Trust the higher timeframe order flow, lock your invalidation levels, and let the institutional setups play out.
Ghi chú
Smart Money doesn't trade assets in isolation. When looking at this 1-month historical structural view, notice the heavy synchronicity between the precious metals sector and the crypto markets.Liquidity Cascades: When institutional deleveraging hits the board, large hedge funds pull raw capital from both digital liquid assets (Bitcoin) and legacy safe-havens (Gold/Silver) to protect their broader equity portfolios. Do not fight the higher-timeframe order flow. Let the market sweep retail trendlines, wait for the mitigation of this Daily Bullish Order Block, and execute only when institutional volume aligns with your bias.
Ghi chú
Retail traders get trapped because they treat Gold and Crypto as completely separate worlds. But look at the data—when a liquidation wave hits, institutional desks dump both Bitcoin and Gold simultaneously to liquidate positions and hold raw cash.Ghi chú
Technical setups achieve maximum probability when backed by real-time fundamental drivers. Today, we are keeping a very close eye on macroeconomic data releases, shifting central bank interest rate expectations, and the continuous traction of the US Dollar Index (DXY). When bond yields and the dollar spike, dollar-denominated assets globally experience direct liquidity pressure. The Cross-Asset Footprint: If you look across the board today, the downside pressure isn't isolated to Gold. We are seeing a highly synchronized liquidation cycle hitting both legacy safe-havens (Gold/Silver) and digital assets (Bitcoin). This is a textbook example of institutional deleveraging—large funds liquidating multiple asset classes simultaneously to buffer capital.
Execution Strategy: Never chase a rapidly dropping market driven by fundamental momentum. Stick to the higher timeframe (HTF) plan. Let the market sweep retail liquidity, wait patiently for price to mitigate our marked Daily Demand Block, and execute only when lower-timeframe order flow confirms that the smart money is stepping back in.

What You'll Get
Daily Forex signals with high accuracy
t.me/+EdfnjydA0JIwZjM8
Technical & fundamental analysis
Risk management tips to protect your capital
Join now and start profit daily free signal
t.me/+EdfnjydA0JIwZjM8
Daily Forex signals with high accuracy
t.me/+EdfnjydA0JIwZjM8
Technical & fundamental analysis
Risk management tips to protect your capital
Join now and start profit daily free signal
t.me/+EdfnjydA0JIwZjM8
Bài đăng liên quan
Thông báo miễn trừ trách nhiệm
Thông tin và các ấn phẩm này không nhằm mục đích, và không cấu thành, lời khuyên hoặc khuyến nghị về tài chính, đầu tư, giao dịch hay các loại khác do TradingView cung cấp hoặc xác nhận. Đọc thêm tại Điều khoản Sử dụng.
What You'll Get
Daily Forex signals with high accuracy
t.me/+EdfnjydA0JIwZjM8
Technical & fundamental analysis
Risk management tips to protect your capital
Join now and start profit daily free signal
t.me/+EdfnjydA0JIwZjM8
Daily Forex signals with high accuracy
t.me/+EdfnjydA0JIwZjM8
Technical & fundamental analysis
Risk management tips to protect your capital
Join now and start profit daily free signal
t.me/+EdfnjydA0JIwZjM8
Bài đăng liên quan
Thông báo miễn trừ trách nhiệm
Thông tin và các ấn phẩm này không nhằm mục đích, và không cấu thành, lời khuyên hoặc khuyến nghị về tài chính, đầu tư, giao dịch hay các loại khác do TradingView cung cấp hoặc xác nhận. Đọc thêm tại Điều khoản Sử dụng.