
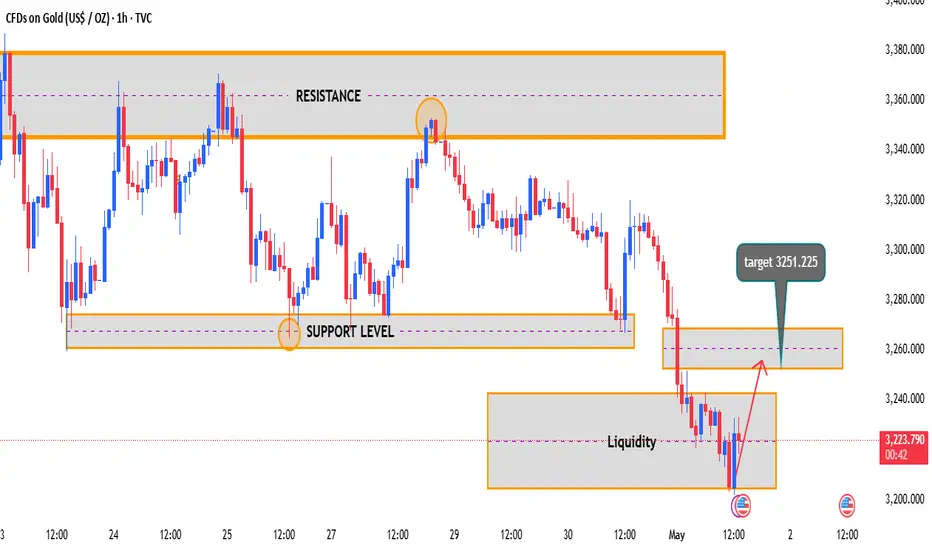
This chart showcases a liquidity grab followed by a potential bullish reaction in Gold (XAU/USD).
Key Technical Highlights:
- Resistance Zone: Clearly defined around the 3,370 level, where price has consistently faced rejection.
- Support Level: Identified near the 3,220–3,230 zone, which was recently swept to collect liquidity.
- Liquidity Zone: Price dipped below support to trigger stop-losses before rebounding, signaling a possible bullish reversal.
Projected Move:
The chart suggests a bounce toward the next target at 3251.225, aligning with a previously broken support now turned resistance.
If momentum sustains, further upside could be explored toward the mid-supply zone.
Summary: The recent liquidity sweep hints at a potential short-term bullish move, with a target retracement to 3251.225. Traders should monitor price reaction at that level for confirmation or rejection.
Key Technical Highlights:
- Resistance Zone: Clearly defined around the 3,370 level, where price has consistently faced rejection.
- Support Level: Identified near the 3,220–3,230 zone, which was recently swept to collect liquidity.
- Liquidity Zone: Price dipped below support to trigger stop-losses before rebounding, signaling a possible bullish reversal.
Projected Move:
The chart suggests a bounce toward the next target at 3251.225, aligning with a previously broken support now turned resistance.
If momentum sustains, further upside could be explored toward the mid-supply zone.
Summary: The recent liquidity sweep hints at a potential short-term bullish move, with a target retracement to 3251.225. Traders should monitor price reaction at that level for confirmation or rejection.

Thông báo miễn trừ trách nhiệm
Thông tin và các ấn phẩm này không nhằm mục đích, và không cấu thành, lời khuyên hoặc khuyến nghị về tài chính, đầu tư, giao dịch hay các loại khác do TradingView cung cấp hoặc xác nhận. Đọc thêm tại Điều khoản Sử dụng.
Thông báo miễn trừ trách nhiệm
Thông tin và các ấn phẩm này không nhằm mục đích, và không cấu thành, lời khuyên hoặc khuyến nghị về tài chính, đầu tư, giao dịch hay các loại khác do TradingView cung cấp hoặc xác nhận. Đọc thêm tại Điều khoản Sử dụng.