
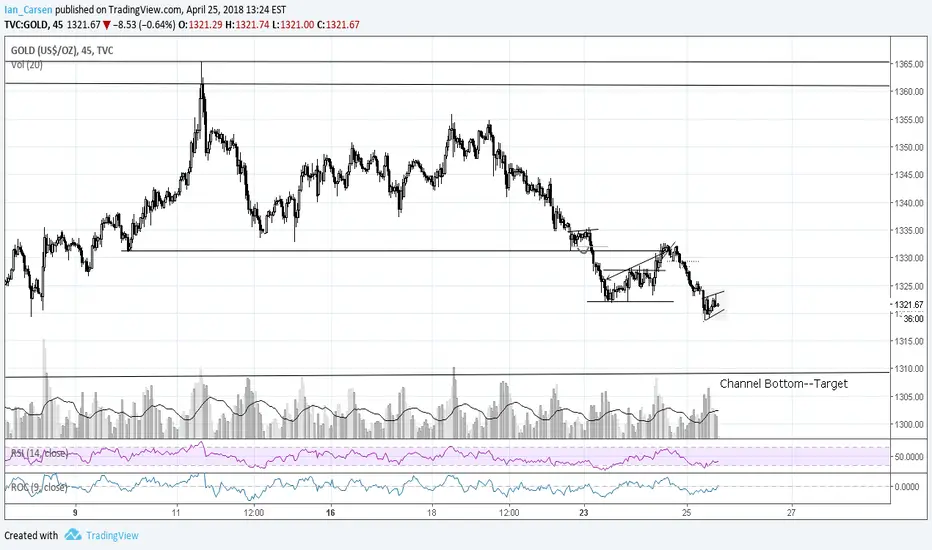
With recent dollar strength and treasury weakness, commodities are taking the hit. Here we have a classic bear flag in Gold A longer-term chart shows Gold in a large rectangular consolidation inside an ascending triangle (triangle on the weekly chart). A break of the bear flag should take price to the boundary of the larger rectangular consolidation, where price may proceed (probably after a partial rise) to fall to the boundary of the triangle, where I would expect it to reverse upwards, however, continuation of the downwards action is always possible.
Good trading and good luck!
Good trading and good luck!

Thông báo miễn trừ trách nhiệm
Thông tin và các ấn phẩm này không nhằm mục đích, và không cấu thành, lời khuyên hoặc khuyến nghị về tài chính, đầu tư, giao dịch hay các loại khác do TradingView cung cấp hoặc xác nhận. Đọc thêm tại Điều khoản Sử dụng.
Thông báo miễn trừ trách nhiệm
Thông tin và các ấn phẩm này không nhằm mục đích, và không cấu thành, lời khuyên hoặc khuyến nghị về tài chính, đầu tư, giao dịch hay các loại khác do TradingView cung cấp hoặc xác nhận. Đọc thêm tại Điều khoản Sử dụng.