
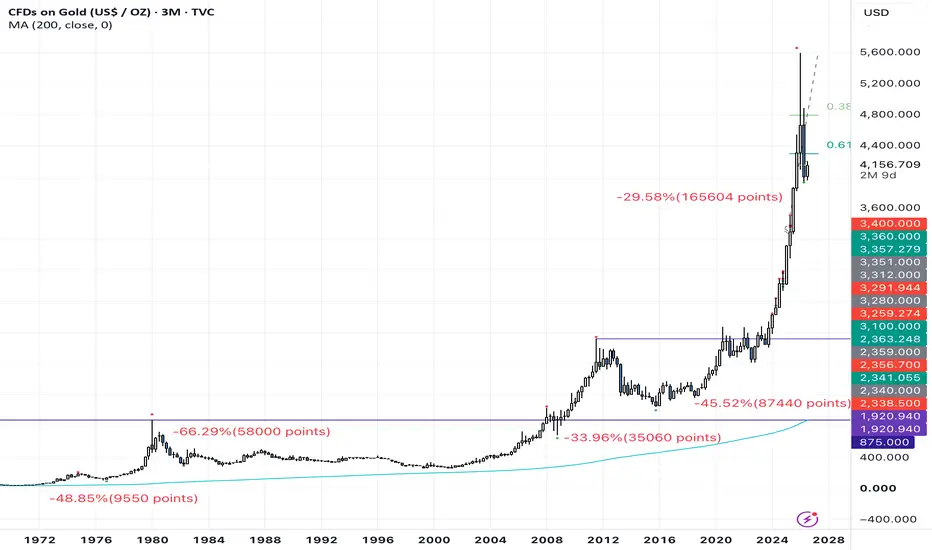
Gold has started to recover after correcting nearly 30% from its recent all-time high.
Looking back over the past 50 years, every major Gold correction tells a different story.
1974–1976: -48.85%
1980–1982: -66.29%
2008: -33.96%
2011–2015: -45.52%
2026 (Current): -29.58%
At first glance, most traders focus only on the percentage decline.
However, what caught my attention was something else.
The absolute price movement has expanded dramatically over time:
1974: ~9,550 points
1980: ~58,000 points
2008: ~35,060 points
2011: ~87,440 points
2026: ~165,604 points (current)
While the percentage corrections remain within a surprisingly similar range, the size of each move in price has grown significantly.
To me, this reflects how much the Gold market has evolved—with greater liquidity, broader institutional participation, ETFs, algorithmic trading, and millions of retail traders worldwide.
This doesn't necessarily mean Gold has become more bearish or more bullish.
It simply reminds us that today's market is not the same market it was 20, 30, or 50 years ago.
Looking back over the past 50 years, every major Gold correction tells a different story.
1974–1976: -48.85%
1980–1982: -66.29%
2008: -33.96%
2011–2015: -45.52%
2026 (Current): -29.58%
At first glance, most traders focus only on the percentage decline.
However, what caught my attention was something else.
The absolute price movement has expanded dramatically over time:
1974: ~9,550 points
1980: ~58,000 points
2008: ~35,060 points
2011: ~87,440 points
2026: ~165,604 points (current)
While the percentage corrections remain within a surprisingly similar range, the size of each move in price has grown significantly.
To me, this reflects how much the Gold market has evolved—with greater liquidity, broader institutional participation, ETFs, algorithmic trading, and millions of retail traders worldwide.
This doesn't necessarily mean Gold has become more bearish or more bullish.
It simply reminds us that today's market is not the same market it was 20, 30, or 50 years ago.

I make a living by drawing charts.
Bài đăng liên quan
Thông báo miễn trừ trách nhiệm
Thông tin và các ấn phẩm này không nhằm mục đích, và không cấu thành, lời khuyên hoặc khuyến nghị về tài chính, đầu tư, giao dịch hay các loại khác do TradingView cung cấp hoặc xác nhận. Đọc thêm tại Điều khoản Sử dụng.
I make a living by drawing charts.
Bài đăng liên quan
Thông báo miễn trừ trách nhiệm
Thông tin và các ấn phẩm này không nhằm mục đích, và không cấu thành, lời khuyên hoặc khuyến nghị về tài chính, đầu tư, giao dịch hay các loại khác do TradingView cung cấp hoặc xác nhận. Đọc thêm tại Điều khoản Sử dụng.