
Amid Recurring Tensions in the Middle East: How to Position for Gold
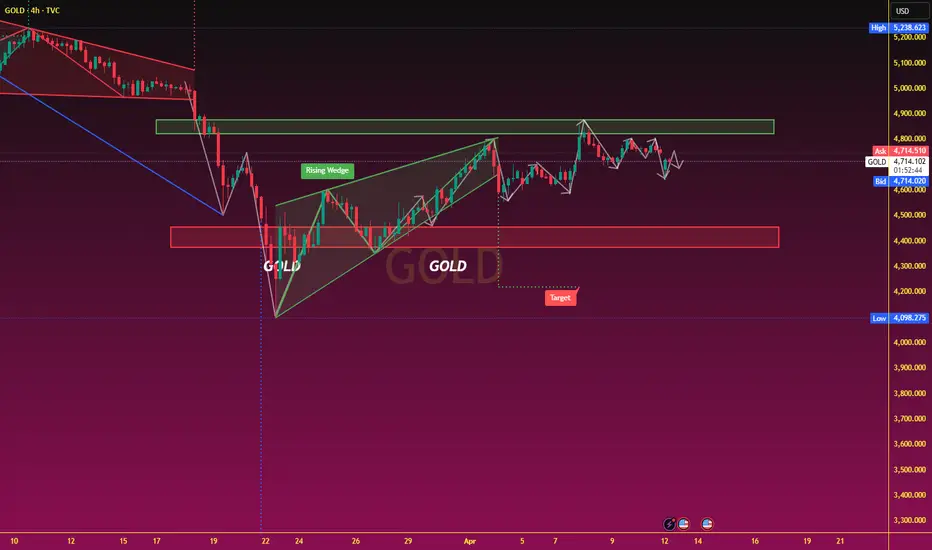
From a technical perspective, the daily chart structure indicates that the RSI has retreated from overbought territory, signaling a weakening of bullish momentum. Gold prices are currently exhibiting a pattern of high-level consolidation with a bearish bias. Key resistance levels are situated in the $4,751 to $4,789 range, while support is concentrated around $4,621 and $4,587.
On the 4-hour timeframe, gold's short-term trajectory displays a pattern of choppy decline; notably, a price gap formed earlier has failed to close quickly, suggesting that selling pressure from above remains persistent. Should the price break below the $4,600 support level, it could proceed to test the $4,550 zone; conversely, if it manages to firmly re-establish itself above $4,750, it holds the potential to reverse its recent short-term decline and close the aforementioned gap.
From a technical perspective, the daily chart structure indicates that the RSI has retreated from overbought territory, signaling a weakening of bullish momentum. Gold prices are currently exhibiting a pattern of high-level consolidation with a bearish bias. Key resistance levels are situated in the $4,751 to $4,789 range, while support is concentrated around $4,621 and $4,587.
On the 4-hour timeframe, gold's short-term trajectory displays a pattern of choppy decline; notably, a price gap formed earlier has failed to close quickly, suggesting that selling pressure from above remains persistent. Should the price break below the $4,600 support level, it could proceed to test the $4,550 zone; conversely, if it manages to firmly re-establish itself above $4,750, it holds the potential to reverse its recent short-term decline and close the aforementioned gap.

Thông báo miễn trừ trách nhiệm
Thông tin và các ấn phẩm này không nhằm mục đích, và không cấu thành, lời khuyên hoặc khuyến nghị về tài chính, đầu tư, giao dịch hay các loại khác do TradingView cung cấp hoặc xác nhận. Đọc thêm tại Điều khoản Sử dụng.
Thông báo miễn trừ trách nhiệm
Thông tin và các ấn phẩm này không nhằm mục đích, và không cấu thành, lời khuyên hoặc khuyến nghị về tài chính, đầu tư, giao dịch hay các loại khác do TradingView cung cấp hoặc xác nhận. Đọc thêm tại Điều khoản Sử dụng.