
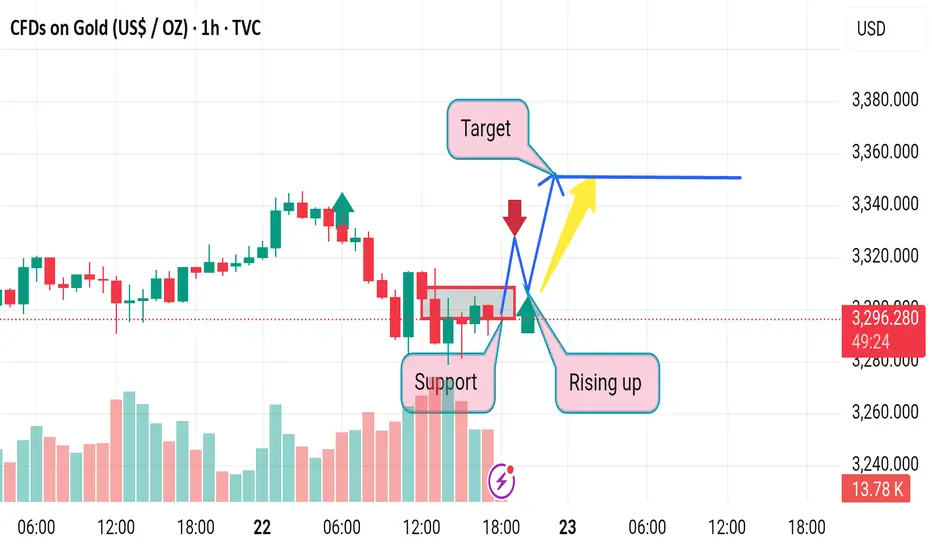
1. Assumption of Support
Observation: The "Support" zone is marked around the 3,285–3,290 level.
Disruption: This area has only a few touches and lacks clear validation. Support should be confirmed with multiple bounces and strong volume reactions. Here, volume is present but inconclusive.
2. Overly Optimistic Target
Observation: The target area is set around 3,350, which assumes a clean breakout.
Disruption: This ignores potential resistance levels between 3,310–3,330 that could act as hurdles. The price might stall or reverse before reaching that far.
3. Breakout Path Assumptions
Observation: The blue arrows suggest a bullish breakout, possibly after a retest.
Disruption: There's a strong red rejection candle marked by a red arrow—suggesting bearish momentum. Without strong bullish confirmation (like a bullish engulfing or volume spike), this breakout path is speculative.
4. Lack of Broader Context
Observation: The chart is isolated to a 1-hour timeframe.
Disruption: No higher timeframe trend is considered. If the 4H or Daily chart shows a downtrend, this small support could be insignificant and might break.
5. Volume Analysis Gaps
Observation: Volume bars are visible but not integrated into the analysis.
Disruption: No divergence or volume support is identified. Rising prices without rising volume can indicate a weak move, increasing failure chances.
Observation: The "Support" zone is marked around the 3,285–3,290 level.
Disruption: This area has only a few touches and lacks clear validation. Support should be confirmed with multiple bounces and strong volume reactions. Here, volume is present but inconclusive.
2. Overly Optimistic Target
Observation: The target area is set around 3,350, which assumes a clean breakout.
Disruption: This ignores potential resistance levels between 3,310–3,330 that could act as hurdles. The price might stall or reverse before reaching that far.
3. Breakout Path Assumptions
Observation: The blue arrows suggest a bullish breakout, possibly after a retest.
Disruption: There's a strong red rejection candle marked by a red arrow—suggesting bearish momentum. Without strong bullish confirmation (like a bullish engulfing or volume spike), this breakout path is speculative.
4. Lack of Broader Context
Observation: The chart is isolated to a 1-hour timeframe.
Disruption: No higher timeframe trend is considered. If the 4H or Daily chart shows a downtrend, this small support could be insignificant and might break.
5. Volume Analysis Gaps
Observation: Volume bars are visible but not integrated into the analysis.
Disruption: No divergence or volume support is identified. Rising prices without rising volume can indicate a weak move, increasing failure chances.

Thông báo miễn trừ trách nhiệm
Thông tin và các ấn phẩm này không nhằm mục đích, và không cấu thành, lời khuyên hoặc khuyến nghị về tài chính, đầu tư, giao dịch hay các loại khác do TradingView cung cấp hoặc xác nhận. Đọc thêm tại Điều khoản Sử dụng.
Thông báo miễn trừ trách nhiệm
Thông tin và các ấn phẩm này không nhằm mục đích, và không cấu thành, lời khuyên hoặc khuyến nghị về tài chính, đầu tư, giao dịch hay các loại khác do TradingView cung cấp hoặc xác nhận. Đọc thêm tại Điều khoản Sử dụng.