
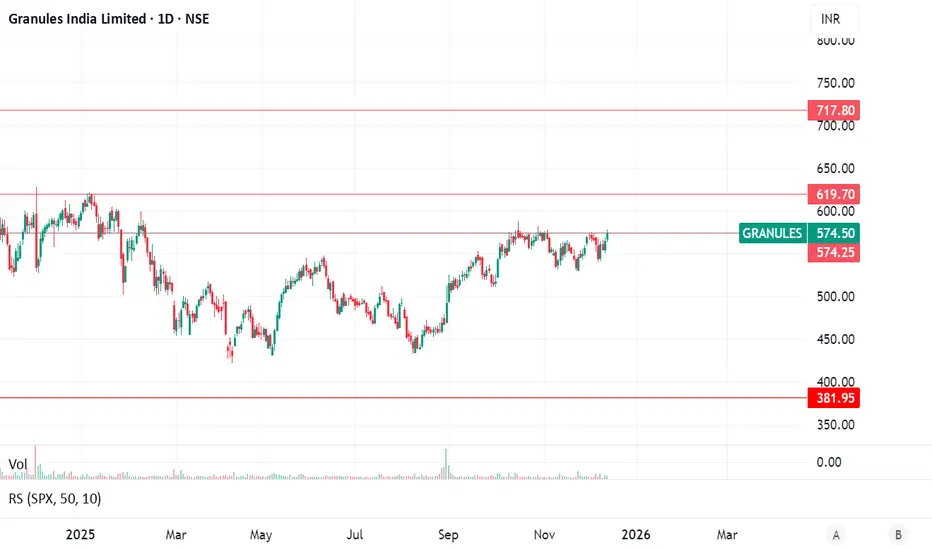
From the daily price chart you shared (with key levels drawn):
Trend Structure
Price is in a consolidation / breakout test phase near a horizontal resistance zone (~₹575–₹620).
Price is above short-term averages and showing series of higher lows — indicating building upside bias.
Support & Resistance Zones
Immediate Resistance: Around ~₹600-₹620.
Upstox - Online Stock and Share Trading
Major Resistance: ~₹710-₹720 (higher timeframe pivot).
Support Levels: ~₹510-₹530 and deeper ~₹450-₹480 on failed breakdown basis.
Value Broking
Technical Indicators
RSI around neutral ~50ish on some screens — suggests neither overbought nor oversold.
Mixed oscillator readings (some buy signals on short term).
Positioning Plan
Parameter Level / Zone
Entry on Breakout Close above ₹620–₹630 with volume confirmation
Alternative Pull-back Entry On dip to ₹550–₹570 if it holds as support
Stop-Loss Levels Conservative: Below ₹510
Aggressive: Below ₹480
Target 1 ~ ₹680–₹710
Target 2 (Stretch) ~ ₹750+
Rationale
A breakout close above ₹620 with volume suggests buyers have taken control.
Pullback entry gives lower risk entry near support clusters from past price action.
Targets align with past swing highs and higher range extremes.
Trailing SL below supports helps protect capital in case structure fails.

Thông báo miễn trừ trách nhiệm
Thông tin và các ấn phẩm này không nhằm mục đích, và không cấu thành, lời khuyên hoặc khuyến nghị về tài chính, đầu tư, giao dịch hay các loại khác do TradingView cung cấp hoặc xác nhận. Đọc thêm tại Điều khoản Sử dụng.
Thông báo miễn trừ trách nhiệm
Thông tin và các ấn phẩm này không nhằm mục đích, và không cấu thành, lời khuyên hoặc khuyến nghị về tài chính, đầu tư, giao dịch hay các loại khác do TradingView cung cấp hoặc xác nhận. Đọc thêm tại Điều khoản Sử dụng.