
Higher Highs, Flip Zone, Liquidity Sweep: Read the Chart
APOORV DUBEY | SEBI Registered Research Analyst
⚠️ This post is for educational purposes only. It is not a recommendation to buy, sell or hold any security.
Why this post?
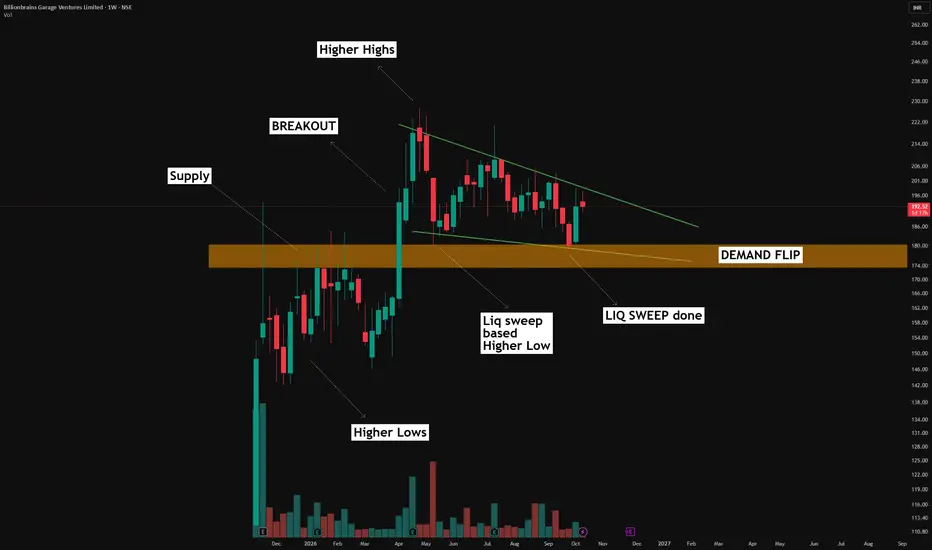
The aim is not to forecast anything. It is to show you how to read price structure yourself, step by step. All the levels discussed are marked on the chart.
1. Higher High, Higher Low structure
A classical uptrend is a series of higher highs (HH) and higher lows (HL).
Each pullback holds above the previous low, and each push goes beyond the previous high.
2. The flip zone
A flip zone is a level that was resistance, got broken, and later acted as support when price returned to it.
Why it matters: it shows the market accepting a new price range. Sellers who defended the level earlier have been absorbed.
3. Liquidity sweep
Liquidity sits where many stops and pending orders cluster, typically below obvious lows or above obvious highs.
Here, price moved down and took out that liquidity.
After the sweep, the market did not trend. It moved into sideways consolidation.
A sweep followed by a range can mean the market is absorbing orders and building a base
This is how I read a chart, not what you should do with it. Study the structure, build your own view and manage your own risk.
Disclaimer: I am a SEBI registered research analyst. This post is not investment advice or a recommendation to buy, sell or hold. Please consult your financial advisor before making any decision.
⚠️ This post is for educational purposes only. It is not a recommendation to buy, sell or hold any security.
Why this post?
The aim is not to forecast anything. It is to show you how to read price structure yourself, step by step. All the levels discussed are marked on the chart.
1. Higher High, Higher Low structure
A classical uptrend is a series of higher highs (HH) and higher lows (HL).
Each pullback holds above the previous low, and each push goes beyond the previous high.
2. The flip zone
A flip zone is a level that was resistance, got broken, and later acted as support when price returned to it.
Why it matters: it shows the market accepting a new price range. Sellers who defended the level earlier have been absorbed.
3. Liquidity sweep
Liquidity sits where many stops and pending orders cluster, typically below obvious lows or above obvious highs.
Here, price moved down and took out that liquidity.
After the sweep, the market did not trend. It moved into sideways consolidation.
A sweep followed by a range can mean the market is absorbing orders and building a base
This is how I read a chart, not what you should do with it. Study the structure, build your own view and manage your own risk.
Disclaimer: I am a SEBI registered research analyst. This post is not investment advice or a recommendation to buy, sell or hold. Please consult your financial advisor before making any decision.

📊Swing & positional research with Buy, Sell & Hold recommendations
Contact for NOVEMBER SLOTS
📞WhatsApp ( Pro ): wa.me/919455664601
📢Free Picks on Telegram ( Join ) : t.me/hashtaghammer
Apoorv Dubey|SEBI RA INH000030287
Contact for NOVEMBER SLOTS
📞WhatsApp ( Pro ): wa.me/919455664601
📢Free Picks on Telegram ( Join ) : t.me/hashtaghammer
Apoorv Dubey|SEBI RA INH000030287
Bài đăng liên quan
Thông báo miễn trừ trách nhiệm
Thông tin và các ấn phẩm này không nhằm mục đích, và không cấu thành, lời khuyên hoặc khuyến nghị về tài chính, đầu tư, giao dịch hay các loại khác do TradingView cung cấp hoặc xác nhận. Đọc thêm tại Điều khoản Sử dụng.
📊Swing & positional research with Buy, Sell & Hold recommendations
Contact for NOVEMBER SLOTS
📞WhatsApp ( Pro ): wa.me/919455664601
📢Free Picks on Telegram ( Join ) : t.me/hashtaghammer
Apoorv Dubey|SEBI RA INH000030287
Contact for NOVEMBER SLOTS
📞WhatsApp ( Pro ): wa.me/919455664601
📢Free Picks on Telegram ( Join ) : t.me/hashtaghammer
Apoorv Dubey|SEBI RA INH000030287
Bài đăng liên quan
Thông báo miễn trừ trách nhiệm
Thông tin và các ấn phẩm này không nhằm mục đích, và không cấu thành, lời khuyên hoặc khuyến nghị về tài chính, đầu tư, giao dịch hay các loại khác do TradingView cung cấp hoặc xác nhận. Đọc thêm tại Điều khoản Sử dụng.