
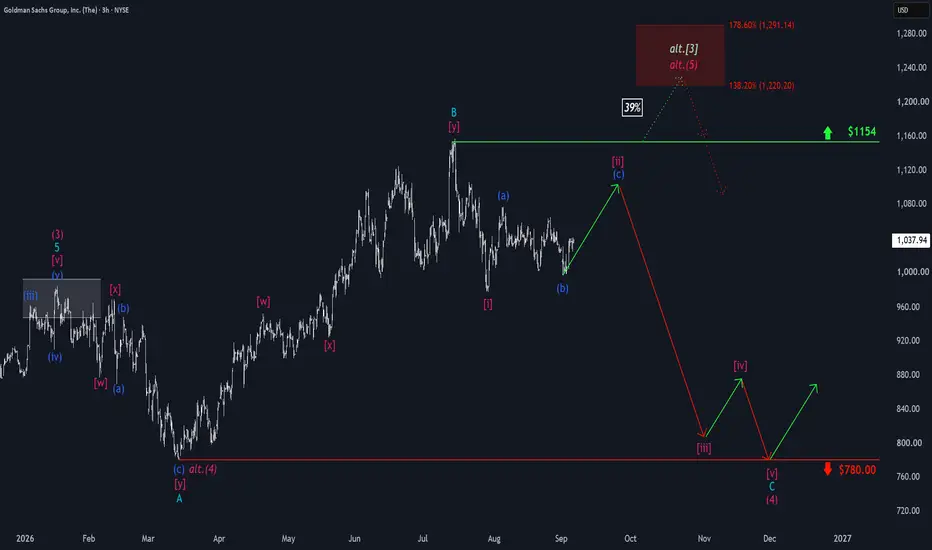
On the first trading day of September, the Goldman Sachs stock slipped just below the $1,000 mark but has since worked its way higher again. Our primary expectation is that the stock is still completing a temporary corrective move to the upside, which should end well below the resistance at $1,154. The price should then decline in stages and form the broader corrective low no later than around the support at $780.00. Once that low is in place, fresh upward moves should unfold. Alternatively, GS could be in the final phase of a broader impulsive move. In that scenario, the stock would break directly above the resistance at $1,154 and advance into our alternative red Target Zone between $1,220.20 and $1,291.14 (probability: 39%). This should then be followed by a significant sell-off as well.

📊 Daily market insights combining macro + Elliott Wave analysis
🚀 Spot trends early with momentum, sentiment & price structure
🌐 Join thousands trading smarter at hkcmglobal.com
🚀 Spot trends early with momentum, sentiment & price structure
🌐 Join thousands trading smarter at hkcmglobal.com
Bài đăng liên quan
Thông báo miễn trừ trách nhiệm
Thông tin và các ấn phẩm này không nhằm mục đích, và không cấu thành, lời khuyên hoặc khuyến nghị về tài chính, đầu tư, giao dịch hay các loại khác do TradingView cung cấp hoặc xác nhận. Đọc thêm tại Điều khoản Sử dụng.
📊 Daily market insights combining macro + Elliott Wave analysis
🚀 Spot trends early with momentum, sentiment & price structure
🌐 Join thousands trading smarter at hkcmglobal.com
🚀 Spot trends early with momentum, sentiment & price structure
🌐 Join thousands trading smarter at hkcmglobal.com
Bài đăng liên quan
Thông báo miễn trừ trách nhiệm
Thông tin và các ấn phẩm này không nhằm mục đích, và không cấu thành, lời khuyên hoặc khuyến nghị về tài chính, đầu tư, giao dịch hay các loại khác do TradingView cung cấp hoặc xác nhận. Đọc thêm tại Điều khoản Sử dụng.