
Overview
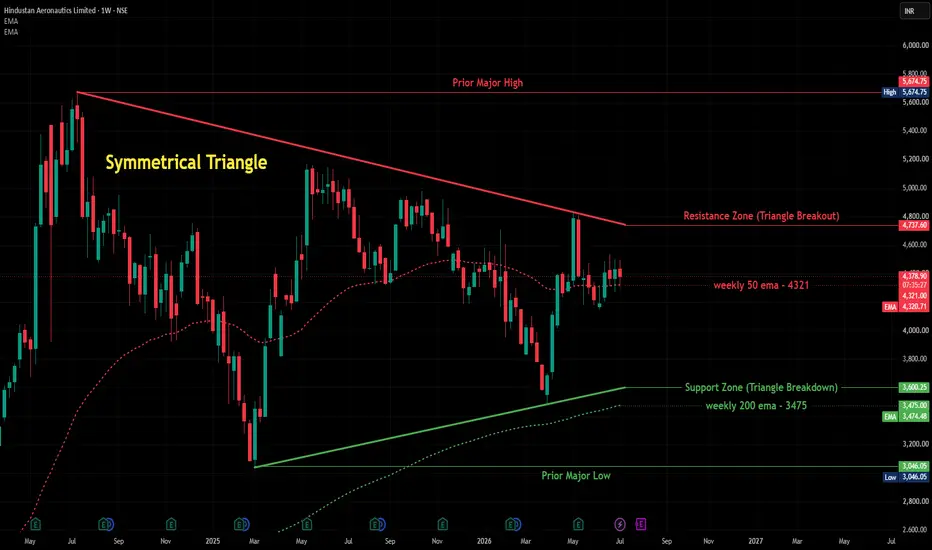
Hindustan Aeronautics has been consolidating inside a large symmetrical triangle since its July 2024 high of 5,674.75, with price now compressing right into the apex around the 4,320–4,385 zone. This is the first time we're covering the defense/aerospace space, and the multi-timeframe setup here — both weekly and daily charts showing the same structure — makes it a notable one to watch.
Pattern Explanation
On the weekly chart, a descending resistance line connects the July 2024 high down through lower highs to the current Resistance Zone at 4,737.60, while a rising support line connects the March 2025 low near 3,046.05 up through higher lows to the current Support Zone at 3,600.25. These two lines are converging, and price is now sitting almost exactly at the 50-week EMA (4,320.96) — a tight coiling right at this average that often precedes a decisive directional move once the triangle resolves. The 200-week EMA (3,474.54) sits well below, closer to the triangle's support boundary, giving a longer-term reference if the pattern resolves lower.

On the daily timeframe, the same structure is visible at finer resolution: price is pinned closely between its own daily EMAs (4,339.93 and 4,344.59), confirming this is a genuine multi-timeframe consolidation rather than noise on a single chart. The daily chart also shows the same descending resistance and rising support lines converging toward the same zone, reinforcing the weekly picture.
Key Levels
Resistance (Triangle Upper Boundary): 4,737.60
Support (Triangle Lower Boundary): 3,600.25
Current Consolidation Zone: 4,320–4,385
50-week EMA: 4,320.96
200-week EMA: 3,474.54
Major Reference High: 5,674.75
Major Reference Low: 3,046.05
Scenarios
If resistance breaks: A close above 4,737.60 would suggest the triangle is resolving bullishly, with the prior swing highs near 5,000–5,200 as a reasonable first reference and the July 2024 high (5,674.75) as a longer-term marker.
If support breaks: A close below 3,600.25 would suggest the triangle is resolving bearishly, with the 200-week EMA (3,474.54) as an immediate reference and the 3,046.05 zone as the next major level below.
Beginner's Lesson
A symmetrical triangle is one of the more neutral chart patterns — unlike an ascending or descending triangle, it doesn't inherently favor one direction. The value of spotting one isn't predicting which way it breaks, but recognizing that the compression itself signals decreasing volatility and an approaching decisive move. Here, the added detail of price consolidating right at the 50-week EMA on the weekly chart, and near dual EMAs on the daily, adds extra weight to this specific zone as the one to watch.
Conclusion
HAL is coiling tightly inside a well-defined symmetrical triangle across both weekly and daily timeframes. As always, wait for a confirmed close beyond either boundary before drawing directional conclusions, and manage risk according to your own plan.
Not investment advice. For educational purposes only. Please consult your financial advisor before making any trading decisions.
Hindustan Aeronautics has been consolidating inside a large symmetrical triangle since its July 2024 high of 5,674.75, with price now compressing right into the apex around the 4,320–4,385 zone. This is the first time we're covering the defense/aerospace space, and the multi-timeframe setup here — both weekly and daily charts showing the same structure — makes it a notable one to watch.
Pattern Explanation
On the weekly chart, a descending resistance line connects the July 2024 high down through lower highs to the current Resistance Zone at 4,737.60, while a rising support line connects the March 2025 low near 3,046.05 up through higher lows to the current Support Zone at 3,600.25. These two lines are converging, and price is now sitting almost exactly at the 50-week EMA (4,320.96) — a tight coiling right at this average that often precedes a decisive directional move once the triangle resolves. The 200-week EMA (3,474.54) sits well below, closer to the triangle's support boundary, giving a longer-term reference if the pattern resolves lower.
On the daily timeframe, the same structure is visible at finer resolution: price is pinned closely between its own daily EMAs (4,339.93 and 4,344.59), confirming this is a genuine multi-timeframe consolidation rather than noise on a single chart. The daily chart also shows the same descending resistance and rising support lines converging toward the same zone, reinforcing the weekly picture.
Key Levels
Resistance (Triangle Upper Boundary): 4,737.60
Support (Triangle Lower Boundary): 3,600.25
Current Consolidation Zone: 4,320–4,385
50-week EMA: 4,320.96
200-week EMA: 3,474.54
Major Reference High: 5,674.75
Major Reference Low: 3,046.05
Scenarios
If resistance breaks: A close above 4,737.60 would suggest the triangle is resolving bullishly, with the prior swing highs near 5,000–5,200 as a reasonable first reference and the July 2024 high (5,674.75) as a longer-term marker.
If support breaks: A close below 3,600.25 would suggest the triangle is resolving bearishly, with the 200-week EMA (3,474.54) as an immediate reference and the 3,046.05 zone as the next major level below.
Beginner's Lesson
A symmetrical triangle is one of the more neutral chart patterns — unlike an ascending or descending triangle, it doesn't inherently favor one direction. The value of spotting one isn't predicting which way it breaks, but recognizing that the compression itself signals decreasing volatility and an approaching decisive move. Here, the added detail of price consolidating right at the 50-week EMA on the weekly chart, and near dual EMAs on the daily, adds extra weight to this specific zone as the one to watch.
Conclusion
HAL is coiling tightly inside a well-defined symmetrical triangle across both weekly and daily timeframes. As always, wait for a confirmed close beyond either boundary before drawing directional conclusions, and manage risk according to your own plan.
Not investment advice. For educational purposes only. Please consult your financial advisor before making any trading decisions.
Đóng lệnh: đạt mục tiêu
Target Achieved ✅ (Triangle Breakout Confirmed)
The original thesis flagged HAL coiling inside a symmetrical triangle on both weekly and daily charts, with a close above 4,737.60 needed to confirm a bullish resolution, with prior swing highs near 5,000–5,200 as the first reference zone.
That's exactly what's played out. Price broke above the triangle's upper boundary and has rallied to a high of 5,055.0 this week, closing at 5,030.0, up 2.44%, right into the 5,000–5,200 reference zone flagged in the original post.
What's next
With the immediate target zone reached, the next level to watch is the July 2024 high (5,674.75), the longer-term marker noted in the original idea. The broken resistance zone (4,737.60) now becomes the level to watch as potential support on any pullback.
Lesson for the community
This is a good example of why symmetrical triangles are treated as neutral until they resolve. The multi-timeframe compression (weekly and daily aligning) gave an extra signal that a decisive move was coming, and the eventual breakout confirmed the bullish resolution.
Closing this update here.

📈 HK Trading Community | Market Structure & Indicator Updates
Telegram: t.me/trendstrike1000
Website: quantumedgepro.netlify.app/
Real traders are built through learning,not tip hunting.So Start Learning How the Market Really Works
Telegram: t.me/trendstrike1000
Website: quantumedgepro.netlify.app/
Real traders are built through learning,not tip hunting.So Start Learning How the Market Really Works
Thông báo miễn trừ trách nhiệm
Thông tin và các ấn phẩm này không nhằm mục đích, và không cấu thành, lời khuyên hoặc khuyến nghị về tài chính, đầu tư, giao dịch hay các loại khác do TradingView cung cấp hoặc xác nhận. Đọc thêm tại Điều khoản Sử dụng.
📈 HK Trading Community | Market Structure & Indicator Updates
Telegram: t.me/trendstrike1000
Website: quantumedgepro.netlify.app/
Real traders are built through learning,not tip hunting.So Start Learning How the Market Really Works
Telegram: t.me/trendstrike1000
Website: quantumedgepro.netlify.app/
Real traders are built through learning,not tip hunting.So Start Learning How the Market Really Works
Thông báo miễn trừ trách nhiệm
Thông tin và các ấn phẩm này không nhằm mục đích, và không cấu thành, lời khuyên hoặc khuyến nghị về tài chính, đầu tư, giao dịch hay các loại khác do TradingView cung cấp hoặc xác nhận. Đọc thêm tại Điều khoản Sử dụng.