Giá mua
HAPI Bottomed?
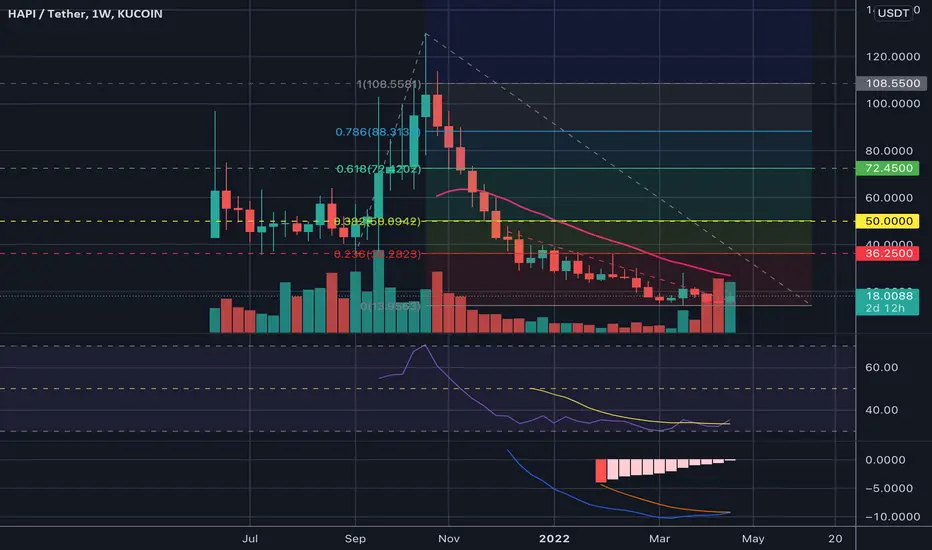
HAPI/USD (Weekly)
- Seem to have found Support at approx. the $15-16 area and range-bound for a while.
- MACD/Signal and Histogram reversing
- Volume increasing over the last 3 weeks
- RSI low reversing
- Looks to be closing above the 50MA on the daily
- Resistance levels marked out by the fib extension (String Resistance will be at $50 and approx $72 area. If we can break above with strength, we should be forming a new high.
- Strong Resistance at the $50 level shown by the Volume Profile
- Seem to have found Support at approx. the $15-16 area and range-bound for a while.
- MACD/Signal and Histogram reversing
- Volume increasing over the last 3 weeks
- RSI low reversing
- Looks to be closing above the 50MA on the daily
- Resistance levels marked out by the fib extension (String Resistance will be at $50 and approx $72 area. If we can break above with strength, we should be forming a new high.
- Strong Resistance at the $50 level shown by the Volume Profile

Thông báo miễn trừ trách nhiệm
Thông tin và các ấn phẩm này không nhằm mục đích, và không cấu thành, lời khuyên hoặc khuyến nghị về tài chính, đầu tư, giao dịch hay các loại khác do TradingView cung cấp hoặc xác nhận. Đọc thêm tại Điều khoản Sử dụng.
Thông báo miễn trừ trách nhiệm
Thông tin và các ấn phẩm này không nhằm mục đích, và không cấu thành, lời khuyên hoặc khuyến nghị về tài chính, đầu tư, giao dịch hay các loại khác do TradingView cung cấp hoặc xác nhận. Đọc thêm tại Điều khoản Sử dụng.