
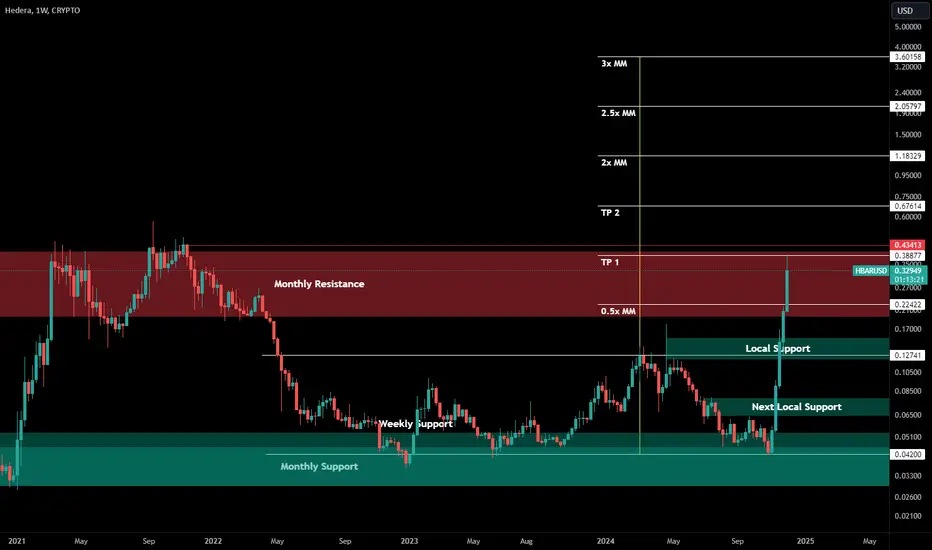
Publishing a monthly support and resistance chart, a weekly view of that chart - with targets - that I've been sharing for a while, so others can follow along.
This in addition to the parallel S/R chart that is already published here:

With an updated snapshot of it here (targets adjusted for where it broke out):

Possible areas of local support if any dips below monthly resistance are marked on the chart.
Hope this helps if you are following HBARUSD
This in addition to the parallel S/R chart that is already published here:
With an updated snapshot of it here (targets adjusted for where it broke out):
Possible areas of local support if any dips below monthly resistance are marked on the chart.
Hope this helps if you are following HBARUSD

Thông báo miễn trừ trách nhiệm
Thông tin và các ấn phẩm này không nhằm mục đích, và không cấu thành, lời khuyên hoặc khuyến nghị về tài chính, đầu tư, giao dịch hay các loại khác do TradingView cung cấp hoặc xác nhận. Đọc thêm tại Điều khoản Sử dụng.
Thông báo miễn trừ trách nhiệm
Thông tin và các ấn phẩm này không nhằm mục đích, và không cấu thành, lời khuyên hoặc khuyến nghị về tài chính, đầu tư, giao dịch hay các loại khác do TradingView cung cấp hoặc xác nhận. Đọc thêm tại Điều khoản Sử dụng.