
📌 Current Price Context
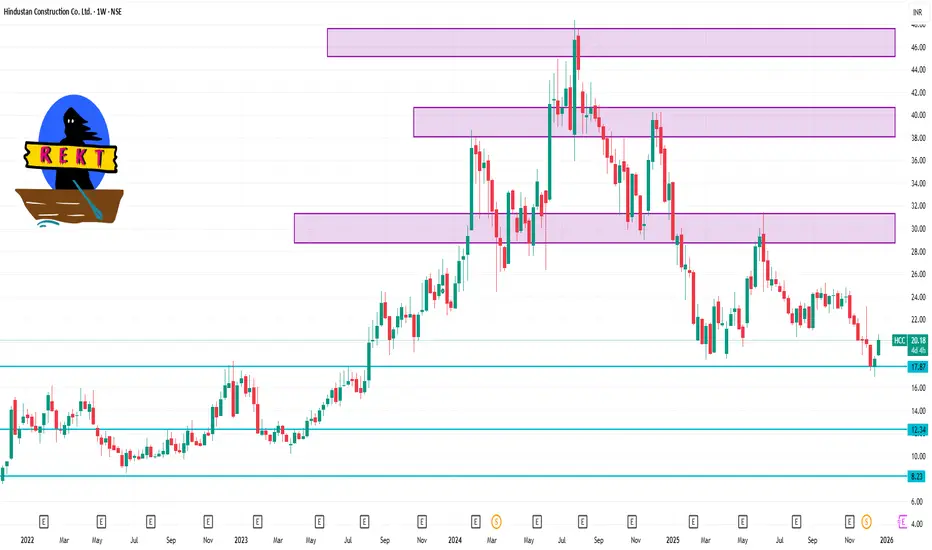
The stock has recently been trading around ₹18.5–₹20.1 (~Dec 19 close ~₹18.54) on NSE/BSE.
It has also shown strong short‑term momentum due to contract news and market interest.
📊 Weekly Levels (1‑Week Time Frame)
🟢 Resistance Levels – Where price may face selling pressure
These are potential upside barriers within the week:
R1: ~₹18.8–₹19.0 — First resistance band seen across pivot and short‑term technical data.
R2: ~₹19.0–₹19.4 — Stronger resistance from pivot clusters and 1‑week range highs.
R3: ~₹19.4+ — Next higher resistance level (weekly context).
👉 Bullish weekly break above ₹19.0–₹19.4 could open scope for further follow‑through.
🔵 Support Levels – Where price may find buying support
Areas where pullbacks may slow or reverse:
S1: ~₹18.15–₹18.20 — Immediate first support zone.
S2: ~₹17.75–₹17.80 — Next short‑term support (close to recent lows).
S3: ~₹17.50–₹17.55 — Key weekly base support range — a break below this could shift weekly structure.
📉 Weekly Pivot Reference
Weekly Pivot area: ~₹17.7–₹17.8 — often used as the short‑term balance zone.
The stock has recently been trading around ₹18.5–₹20.1 (~Dec 19 close ~₹18.54) on NSE/BSE.
It has also shown strong short‑term momentum due to contract news and market interest.
📊 Weekly Levels (1‑Week Time Frame)
🟢 Resistance Levels – Where price may face selling pressure
These are potential upside barriers within the week:
R1: ~₹18.8–₹19.0 — First resistance band seen across pivot and short‑term technical data.
R2: ~₹19.0–₹19.4 — Stronger resistance from pivot clusters and 1‑week range highs.
R3: ~₹19.4+ — Next higher resistance level (weekly context).
👉 Bullish weekly break above ₹19.0–₹19.4 could open scope for further follow‑through.
🔵 Support Levels – Where price may find buying support
Areas where pullbacks may slow or reverse:
S1: ~₹18.15–₹18.20 — Immediate first support zone.
S2: ~₹17.75–₹17.80 — Next short‑term support (close to recent lows).
S3: ~₹17.50–₹17.55 — Key weekly base support range — a break below this could shift weekly structure.
📉 Weekly Pivot Reference
Weekly Pivot area: ~₹17.7–₹17.8 — often used as the short‑term balance zone.

Contact Knowledgehub for a detailed consultation: Dm on WhatsApp: [wa.link/a2o0kz]-
Phone No: [+91 93102 26243]-
Email: [tradingviewknowledgehub@gmail.com]---
-- Let’s achieve success together!
Phone No: [+91 93102 26243]-
Email: [tradingviewknowledgehub@gmail.com]---
-- Let’s achieve success together!
Bài đăng liên quan
Thông báo miễn trừ trách nhiệm
Thông tin và các ấn phẩm này không nhằm mục đích, và không cấu thành, lời khuyên hoặc khuyến nghị về tài chính, đầu tư, giao dịch hay các loại khác do TradingView cung cấp hoặc xác nhận. Đọc thêm tại Điều khoản Sử dụng.
Contact Knowledgehub for a detailed consultation: Dm on WhatsApp: [wa.link/a2o0kz]-
Phone No: [+91 93102 26243]-
Email: [tradingviewknowledgehub@gmail.com]---
-- Let’s achieve success together!
Phone No: [+91 93102 26243]-
Email: [tradingviewknowledgehub@gmail.com]---
-- Let’s achieve success together!
Bài đăng liên quan
Thông báo miễn trừ trách nhiệm
Thông tin và các ấn phẩm này không nhằm mục đích, và không cấu thành, lời khuyên hoặc khuyến nghị về tài chính, đầu tư, giao dịch hay các loại khác do TradingView cung cấp hoặc xác nhận. Đọc thêm tại Điều khoản Sử dụng.