
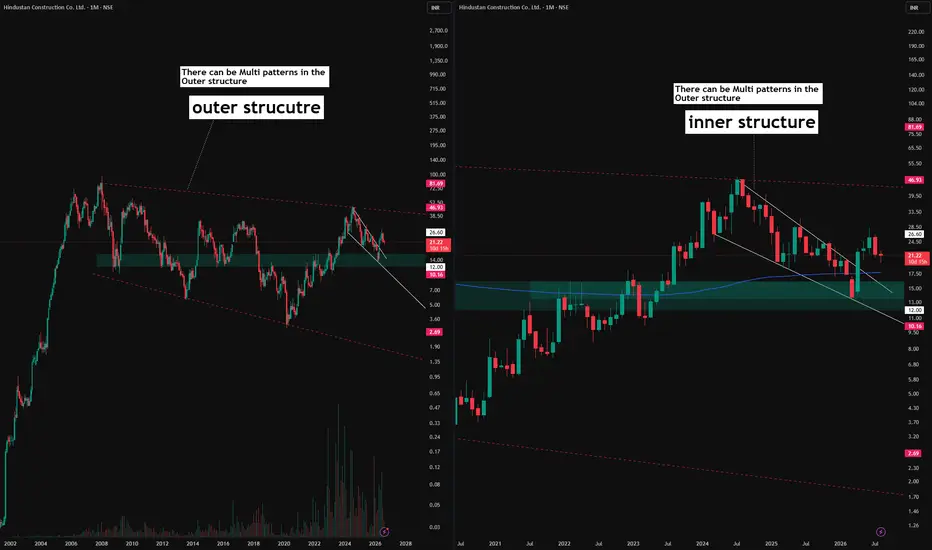
All price action shown in this chart is historical and older than three months. This post is purely educational and observational in nature. It is not a forecast or a trading recommendation.
A Different Way of Reading a Chart
Most discussions around chart patterns focus on identifying multiple patterns coexisting within a single structure, for example a triangle forming alongside a parallel channel within the same price range. This post is about something different, a concept of multi layered structures, where an entire outer structure contains within it a completely separate inner structure, each capable of holding its own set of patterns.
The Outer Structure (Pink Dotted Line)
Marked with a pink dotted line is the broader, outer structure of this stock on the monthly timeframe. This represents the larger boundary within which the overall price action has developed over time.
The Inner Structure (White Line)
Marked with a white line, also on the monthly timeframe, is a separate inner structure forming within that same outer boundary. This inner structure develops its own pattern, distinct from whatever pattern may be forming on the outer layer.
Why This Distinction Matters
This is not simply about multiple patterns overlapping in the same space. It is about recognizing that a chart can have depth, an outer layer telling one structural story, and an inner layer nested within it telling a different one. Both layers can independently develop their own patterns, meaning a stock could be forming one type of structure on the outer boundary while simultaneously building an entirely different structure inside it.
A Different Way of Reading a Chart
Most discussions around chart patterns focus on identifying multiple patterns coexisting within a single structure, for example a triangle forming alongside a parallel channel within the same price range. This post is about something different, a concept of multi layered structures, where an entire outer structure contains within it a completely separate inner structure, each capable of holding its own set of patterns.
The Outer Structure (Pink Dotted Line)
Marked with a pink dotted line is the broader, outer structure of this stock on the monthly timeframe. This represents the larger boundary within which the overall price action has developed over time.
The Inner Structure (White Line)
Marked with a white line, also on the monthly timeframe, is a separate inner structure forming within that same outer boundary. This inner structure develops its own pattern, distinct from whatever pattern may be forming on the outer layer.
Why This Distinction Matters
This is not simply about multiple patterns overlapping in the same space. It is about recognizing that a chart can have depth, an outer layer telling one structural story, and an inner layer nested within it telling a different one. Both layers can independently develop their own patterns, meaning a stock could be forming one type of structure on the outer boundary while simultaneously building an entirely different structure inside it.

📊Swing & positional research with Buy, Sell & Hold recommendations
Contact for NOVEMBER SLOTS
📞WhatsApp ( Pro ): wa.me/919455664601
📢Free Picks on Telegram ( Join ) : t.me/hashtaghammer
Apoorv Dubey|SEBI RA INH000030287
Contact for NOVEMBER SLOTS
📞WhatsApp ( Pro ): wa.me/919455664601
📢Free Picks on Telegram ( Join ) : t.me/hashtaghammer
Apoorv Dubey|SEBI RA INH000030287
Bài đăng liên quan
Thông báo miễn trừ trách nhiệm
Thông tin và các ấn phẩm này không nhằm mục đích, và không cấu thành, lời khuyên hoặc khuyến nghị về tài chính, đầu tư, giao dịch hay các loại khác do TradingView cung cấp hoặc xác nhận. Đọc thêm tại Điều khoản Sử dụng.
📊Swing & positional research with Buy, Sell & Hold recommendations
Contact for NOVEMBER SLOTS
📞WhatsApp ( Pro ): wa.me/919455664601
📢Free Picks on Telegram ( Join ) : t.me/hashtaghammer
Apoorv Dubey|SEBI RA INH000030287
Contact for NOVEMBER SLOTS
📞WhatsApp ( Pro ): wa.me/919455664601
📢Free Picks on Telegram ( Join ) : t.me/hashtaghammer
Apoorv Dubey|SEBI RA INH000030287
Bài đăng liên quan
Thông báo miễn trừ trách nhiệm
Thông tin và các ấn phẩm này không nhằm mục đích, và không cấu thành, lời khuyên hoặc khuyến nghị về tài chính, đầu tư, giao dịch hay các loại khác do TradingView cung cấp hoặc xác nhận. Đọc thêm tại Điều khoản Sử dụng.