
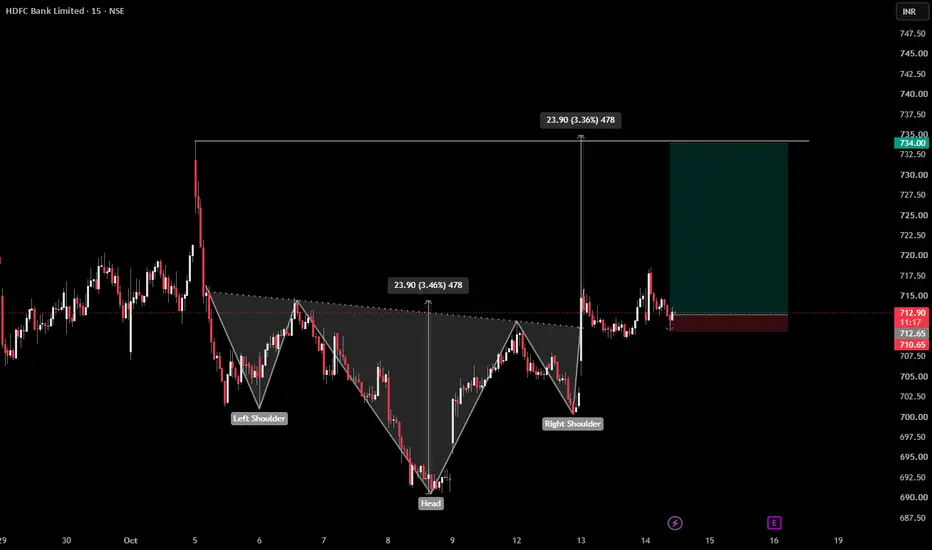
**Pattern:** Inverse Head & Shoulders
**Market:** NSE – HDFC Bank
**Timeframe:** 15 Minutes
**Neckline Breakout:** ₹712–713 Zone
**Potential Target:** ₹734
**Stop Loss:** ₹710.65
HDFC Bank is showing a potential bullish reversal structure on the 15-minute chart, forming an Inverse Head & Shoulders pattern after a downtrend.
The price has moved above the neckline zone, indicating a possible shift in short-term momentum. A sustained breakout above the neckline, followed by successful retest and buying confirmation, could support further upside toward the ₹734 resistance zone.
**Trade Plan:**
- Entry: After confirmed neckline breakout or successful retest.
- Stop Loss: Below ₹710.65, as per the illustrated setup.
- Target: ₹734.
- Risk Management: Maintain disciplined position sizing and avoid chasing price after a sharp move.
**Important:** The breakout needs confirmation through candle close and follow-through. A move back below the neckline may invalidate the bullish setup.
This is a technical analysis idea, not a guaranteed prediction or financial advice. Always manage your risk.
Giao dịch đang hoạt động
1:1 DoneĐóng lệnh: đạt mục tiêu
TARGET REACHED 
Thông báo miễn trừ trách nhiệm
Thông tin và các ấn phẩm này không nhằm mục đích, và không cấu thành, lời khuyên hoặc khuyến nghị về tài chính, đầu tư, giao dịch hay các loại khác do TradingView cung cấp hoặc xác nhận. Đọc thêm tại Điều khoản Sử dụng.
Thông báo miễn trừ trách nhiệm
Thông tin và các ấn phẩm này không nhằm mục đích, và không cấu thành, lời khuyên hoặc khuyến nghị về tài chính, đầu tư, giao dịch hay các loại khác do TradingView cung cấp hoặc xác nhận. Đọc thêm tại Điều khoản Sử dụng.