Long
HDRN daily still has a little more bullishness before pullback
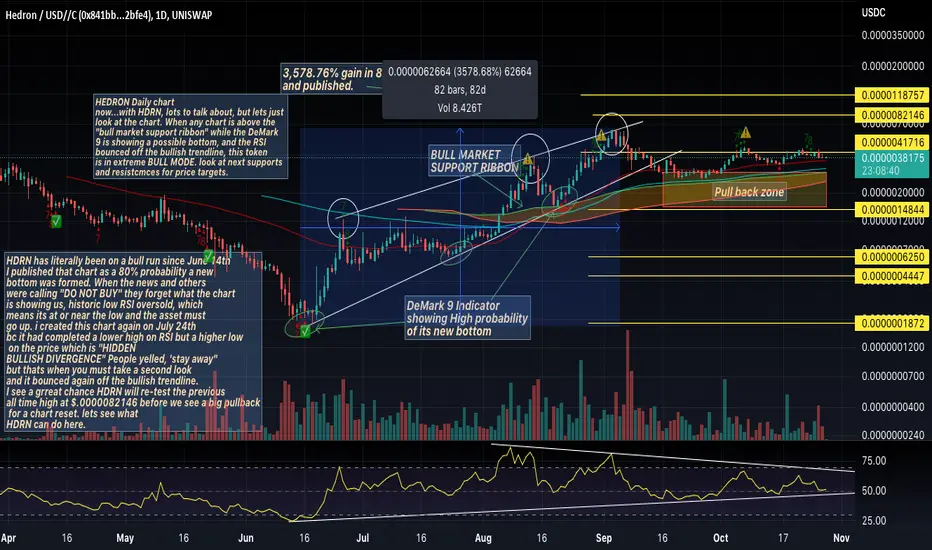
HDRN has literally been on a bull run since June 14th
I published that chart as a 80% probability a new
bottom was formed. When the news and others
were calling "DO NOT BUY" they forget what the chart
is showing us, historic low RSI oversold, which
means its at or near the low and the asset must
go up. i created this chart again on July 24th
bc it had completed a lower high on RSI but a higher low
on the price which is "HIDDEN
BULLISH DIVERGENCE" People yelled, 'stay away"
but thats when you must take a second look
and it bounced again off the bullish trendline.
I see a grreat chance HDRN will re-test the previous
all time high at $.0000082146 before we see a big pullback
for a chart reset. lets see what
HDRN can do here.
I published that chart as a 80% probability a new
bottom was formed. When the news and others
were calling "DO NOT BUY" they forget what the chart
is showing us, historic low RSI oversold, which
means its at or near the low and the asset must
go up. i created this chart again on July 24th
bc it had completed a lower high on RSI but a higher low
on the price which is "HIDDEN
BULLISH DIVERGENCE" People yelled, 'stay away"
but thats when you must take a second look
and it bounced again off the bullish trendline.
I see a grreat chance HDRN will re-test the previous
all time high at $.0000082146 before we see a big pullback
for a chart reset. lets see what
HDRN can do here.

Bài đăng liên quan
Thông báo miễn trừ trách nhiệm
Thông tin và các ấn phẩm này không nhằm mục đích, và không cấu thành, lời khuyên hoặc khuyến nghị về tài chính, đầu tư, giao dịch hay các loại khác do TradingView cung cấp hoặc xác nhận. Đọc thêm tại Điều khoản Sử dụng.
Bài đăng liên quan
Thông báo miễn trừ trách nhiệm
Thông tin và các ấn phẩm này không nhằm mục đích, và không cấu thành, lời khuyên hoặc khuyến nghị về tài chính, đầu tư, giao dịch hay các loại khác do TradingView cung cấp hoặc xác nhận. Đọc thêm tại Điều khoản Sử dụng.