
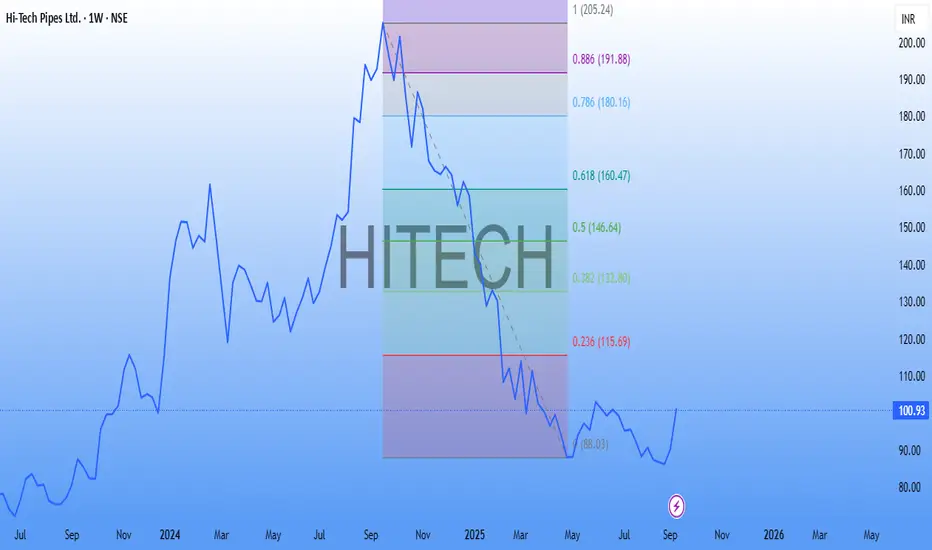
📊 Hi-Tech Pipes Ltd (NSE: HITECH) – Weekly Technical Analysis
The stock has witnessed a prolonged downtrend from its highs and recently formed a strong bullish reversal candle, signaling a potential short-term trend reversal. Key indicators are also turning positive, supporting the possibility of an upward move.
🔎 Technical Observations
Price Action:
After a steep fall from ~₹140 levels, the stock took support near ₹88–90.
A strong green weekly candle has appeared with good momentum, suggesting renewed buying interest.
RSI has bounced from oversold territory, indicating strength.
MACD has shown a bullish crossover, with the histogram turning green, confirming momentum shift.
The recent bullish candle was backed by higher-than-average volume, a sign of accumulation.
📌 Trading Plan
Entry Zone: ₹95 – ₹102
Stop-Loss: ₹88 (weekly close basis)
Target 1: ₹110 – ₹115
Target 2: ₹125 – ₹130
Target 3: ₹140 – ₹145
⚠️ Key Notes
Sustaining above ₹115 with strong volume will be crucial for further upside.
Since the broader trend is still weak, treat this as a pullback rally until the stock closes above ₹130+.
Booking partial profits at each target level is advised to protect gains.
📢 Conclusion
Hi-Tech Pipes Ltd is showing early signs of a reversal after a long decline. The combination of price action, momentum indicators, and support zone bounce makes it an attractive short-term opportunity. However, strict stop-loss management is necessary given the prior downtrend.
Giao dịch đang hoạt động
High made 123.30. Tanked 20% in a weekGhi chú
HIgh made 127
Thông báo miễn trừ trách nhiệm
Thông tin và các ấn phẩm này không nhằm mục đích, và không cấu thành, lời khuyên hoặc khuyến nghị về tài chính, đầu tư, giao dịch hay các loại khác do TradingView cung cấp hoặc xác nhận. Đọc thêm tại Điều khoản Sử dụng.
Thông báo miễn trừ trách nhiệm
Thông tin và các ấn phẩm này không nhằm mục đích, và không cấu thành, lời khuyên hoặc khuyến nghị về tài chính, đầu tư, giao dịch hay các loại khác do TradingView cung cấp hoặc xác nhận. Đọc thêm tại Điều khoản Sử dụng.