
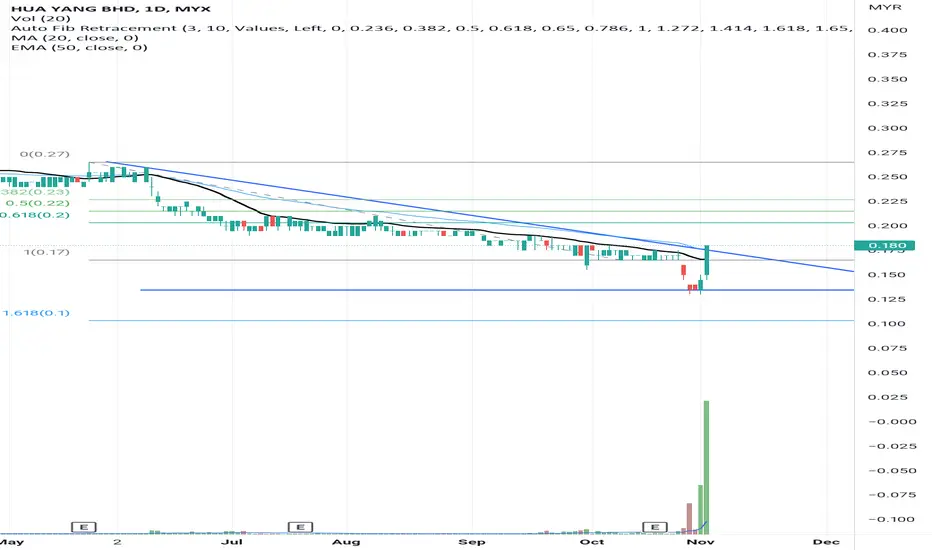
The candlestick indicates a price breakout above the " triangle" pattern neckline on 2 Oct 2022 backend with volumes. Thus, closed above the SMA line where the stock has consolidated and formed a "return move".
The MACD indicates a divergent pattern where confirming the initial significant price movement toward the next price resistance.
The RSI indicates a bullish reading backed by a positive signals in the trend.
Let's save HUAYANG in WL and watch out significant price movement toward the next price resistant backed by volumes.
R 0.195
S 0.160

Thông báo miễn trừ trách nhiệm
Thông tin và các ấn phẩm này không nhằm mục đích, và không cấu thành, lời khuyên hoặc khuyến nghị về tài chính, đầu tư, giao dịch hay các loại khác do TradingView cung cấp hoặc xác nhận. Đọc thêm tại Điều khoản Sử dụng.
Thông báo miễn trừ trách nhiệm
Thông tin và các ấn phẩm này không nhằm mục đích, và không cấu thành, lời khuyên hoặc khuyến nghị về tài chính, đầu tư, giao dịch hay các loại khác do TradingView cung cấp hoặc xác nhận. Đọc thêm tại Điều khoản Sử dụng.