 HYMC
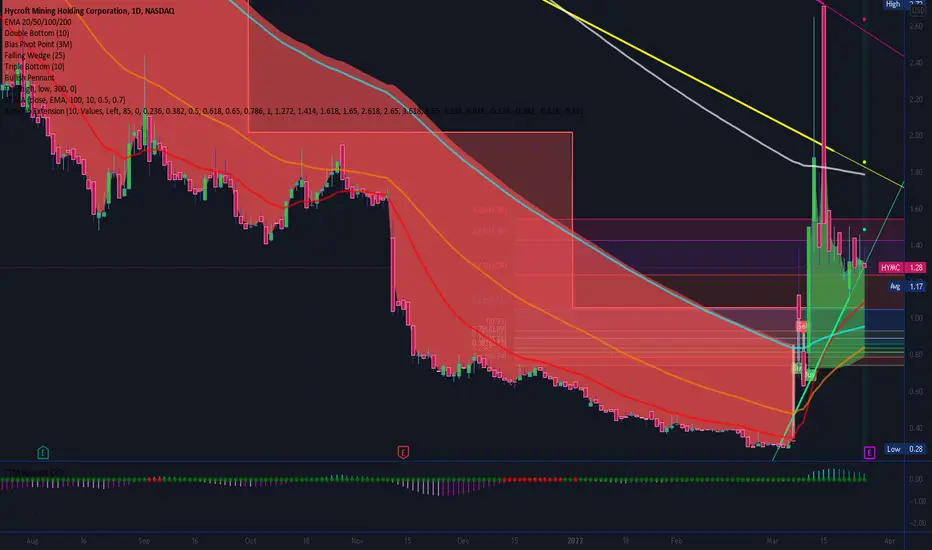
STAKK analysis on the HYMC stock (hycroftmining.com/)
Chart 1 Day
EMA (Exponential Moving Average): Bullish, as the 20EMA has crossed the 50EMA and 100EMA
Red line (20)
Orange line (50)
Blue line (100)
White line (200)
TTM Squeeze: Trending down, meaning momentum is low. Traders may be taking profits. Also notice that gap down on Nov. 9th has been filled.
Fib Levels: Above 2.618. The price has gone parabolic. Price action has to stay above this levels for the bullish trend to continue.
Candle Stick: Last few candles are bearish candles. last day candle is a "Bearish Pin Bar"
Pattern: Current pattern is an Ascending Triangle. This is a bilateral pattern with could result in either a bullish or bearish price action.
News: Hope coming earnings. On March 15th, AMC bought into the company ($194 Million)
History: Price have crashed on earnings report.
Bullish case: Price action could move to the $1.48 to $1.85 to $2.62 (each are major resistance areas).
Bearish case: Price could drop down to $.93 (1 fib) or $.73 (0 fib)

STAKK
Thông báo miễn trừ trách nhiệm
Thông tin và các ấn phẩm này không nhằm mục đích, và không cấu thành, lời khuyên hoặc khuyến nghị về tài chính, đầu tư, giao dịch hay các loại khác do TradingView cung cấp hoặc xác nhận. Đọc thêm tại Điều khoản Sử dụng.
STAKK
Thông báo miễn trừ trách nhiệm
Thông tin và các ấn phẩm này không nhằm mục đích, và không cấu thành, lời khuyên hoặc khuyến nghị về tài chính, đầu tư, giao dịch hay các loại khác do TradingView cung cấp hoặc xác nhận. Đọc thêm tại Điều khoản Sử dụng.