
ICICI Bank: High-Volume Reversal Attempt Emerges as Weakening Downtrend Approaches Critical Structural Pivot
Market Context & Structural Shift
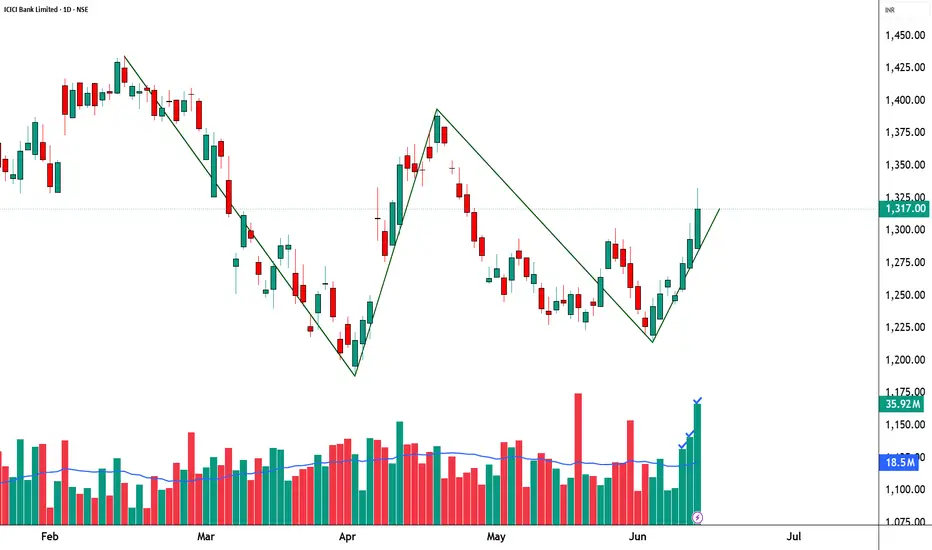
ICICI Bank is displaying an increasingly constructive technical profile on the daily timeframe as a weakening downtrend begins transitioning into a potential recovery phase. While the broader trend has not yet fully reversed, recent price action suggests that selling pressure is losing intensity and buyers are gradually regaining control.
The most significant development on the chart is the emergence of a Three White Soldiers reversal pattern accompanied by exceptionally strong participation. The latest session recorded volume of 35.92 million shares, one of the strongest volume expansions observed in recent weeks. From an institutional perspective, volume acts as the validation mechanism behind price movement. Strong bullish candles supported by expanding participation often indicate that buying interest is becoming more committed rather than merely speculative.
The recent advance is particularly noteworthy because it follows a prolonged corrective phase. Instead of continuing lower, the stock established a higher low structure and subsequently attracted increasingly aggressive buying activity. This shift suggests a gradual transition from distribution toward accumulation.
While some market participants may identify a developing W-shaped recovery structure, it is important to note that the pattern remains incomplete. The neckline region has not yet been tested, meaning the current move should be viewed as a recovery attempt within a broader structural repair process rather than a confirmed major breakout.
At present, the technical evidence supports a narrative of improving momentum, strengthening participation, and a weakening downtrend that is approaching an important decision point.
________________________________________
Multi-Day Swing Setup & Execution Framework
The current setup revolves around the Reference Zone at ₹1,333.00, which serves as the primary structural pivot for the ongoing recovery.
With price currently trading at ₹1,317.00, the market remains slightly below this confirmation area. A sustained move toward and above ₹1,333.00 would indicate improving acceptance of higher prices and strengthen the probability of continuation toward overhead resistance levels.
Immediate Structural Hurdle
Reference Zone: ₹1,333.00
This remains the most important level in the near term. Successful acceptance above this zone would confirm that buyers are maintaining control following the recent reversal signal.
Resistance Framework
Resistance 1: ₹1,337.83
The first supply area likely to attract short-term profit-taking activity. Sustained trading above this level would further strengthen the recovery narrative.
Resistance 2: ₹1,358.67
A move into this zone would indicate increasing confidence among market participants and continued trend repair.
Resistance 3: ₹1,384.33
This level carries elevated significance because it aligns closely with the upper boundary of the recent trading structure and represents a major supply region.
Higher Range: ₹1,393.10
The ₹1,384–₹1,393 region represents the most important upside decision zone visible on the chart. This area may effectively function as the neckline region of the developing W-shaped structure. A decisive breakout above this zone would materially strengthen the medium-term technical outlook.
Extended Upside Reference Zones
Upside Reference 1: ₹1,414.70
A move toward this region would indicate that the recovery has evolved into a broader trend continuation phase rather than a simple rebound.
Upside Reference 2: ₹1,496.35
This represents the larger structural upside reference visible on the chart and would only become relevant if momentum remains strong following a successful breakout above the higher range.
________________________________________
Support Infrastructure & Risk Management
Despite the improving technical backdrop, disciplined risk management remains critical because the stock is still operating within a broader recovery framework.
Support Structure
Support 1: ₹1,291.33
This is the nearest support level and serves as the first indication of whether buyers remain committed during any pullback.
Support 2: ₹1,265.67
A decline toward this region would suggest weakening momentum and require closer monitoring of the recovery structure.
Support 3: ₹1,244.83
This level represents the final major support zone before the broader bullish thesis begins to deteriorate.
Lower Range: ₹1,200.50
A move toward this area would indicate a significant breakdown in the current recovery attempt and re-establish broader downside pressure.
Technical Invalidation
Stop Loss: ₹1,251.30
This level serves as the primary technical invalidation point for the current swing framework. A decisive break below this level would suggest that buyers have failed to maintain control following the recent reversal signal.
Risk Assessment
The setup currently carries a defined risk of ₹81.70 per share between the reference zone and the stop-loss level.
Given this risk profile, position sizing should be adjusted appropriately to ensure that portfolio exposure remains aligned with individual risk-management objectives. Strong technical setups may improve probabilities, but preserving capital remains the primary objective of professional market participation.
________________________________________
Technical Conclusion
ICICI Bank is exhibiting multiple signs of technical improvement as a weakening downtrend begins showing characteristics of a potential recovery phase. The emergence of a Three White Soldiers reversal pattern, combined with exceptionally strong volume of 35.92 million shares, provides meaningful evidence that buying participation is increasing.
The key observation is not merely the candlestick formation itself, but the combination of higher lows, expanding volume, improving momentum, and strengthening demand participation. Together, these factors suggest that the stock is undergoing a process of structural repair.
The immediate focus remains on the ₹1,333.00 reference zone. Sustained acceptance above this level would strengthen the bullish case and open the path toward ₹1,337.83, ₹1,358.67, and ultimately the major ₹1,384–₹1,393 decision zone.
While a developing W-shaped recovery structure may be emerging, confirmation would require a decisive breakout above the higher-range resistance area. Until then, the chart should be viewed as a volume-confirmed recovery attempt with improving technical characteristics rather than a completed trend reversal.
________________________________________
Educational Disclaimer
This analysis is provided solely for educational and informational purposes and reflects a technical interpretation of price action, volume behaviour, market structure, and chart patterns. It does not constitute investment advice, a recommendation, or an offer to buy or sell any financial instrument. All market participants should conduct their own independent research and consult a SEBI-registered investment advisor before making any investment or trading decisions.

STWP | Mentor & Demand-Supply Specialist |
Empowering traders through structured learning |
simpletradewithpatience.com
chat.whatsapp.com/CpgyHCfioQ5Hxf7rd8pDqw
wa.me/message/6IOPHGOXMGZ4N1
Educational Only
Empowering traders through structured learning |
simpletradewithpatience.com
chat.whatsapp.com/CpgyHCfioQ5Hxf7rd8pDqw
wa.me/message/6IOPHGOXMGZ4N1
Educational Only
Thông báo miễn trừ trách nhiệm
Thông tin và các ấn phẩm này không nhằm mục đích, và không cấu thành, lời khuyên hoặc khuyến nghị về tài chính, đầu tư, giao dịch hay các loại khác do TradingView cung cấp hoặc xác nhận. Đọc thêm tại Điều khoản Sử dụng.