Long
Bullish- Long Play
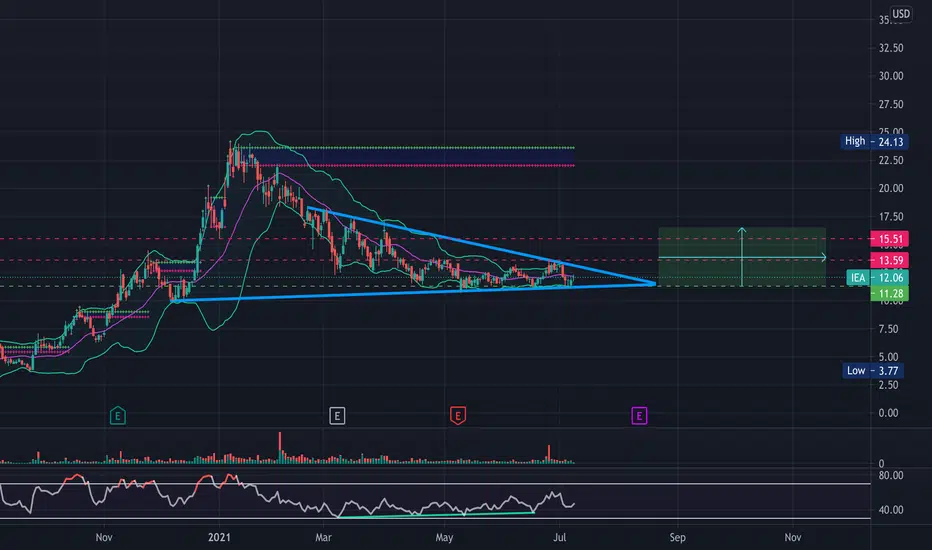
- IEA has been consolidating in this triangle for quite some time now. Undoubtably a long-term play, has held its support and looks to have found a bottom, with volume should really pop
- Hidden bullish divergence on the RSI
- Bollinger Bands squeezing indicating a big move
- Buyer volume starting to pick up again
- Held support at the $11.28 level, has resistance circa $13.59 and $15.51
PT1- $13.65
PT2- $14.80
PT3- $15.75
- Hidden bullish divergence on the RSI
- Bollinger Bands squeezing indicating a big move
- Buyer volume starting to pick up again
- Held support at the $11.28 level, has resistance circa $13.59 and $15.51
PT1- $13.65
PT2- $14.80
PT3- $15.75
Ghi chú
Ghi chú
IEA is nearing the end of the symmetrical triangle previously charted. While still holding that formation is also forming what appears to be a falling wedge ( bullish ). Bollinger bands are squeezing along with a MACD cross to close on Friday. Just some support and resistance levels to watch, see updated chart. Bullish will be looking for a breakout-Ghi chú
Price Target 1 reached ✅
Thông báo miễn trừ trách nhiệm
Thông tin và các ấn phẩm này không nhằm mục đích, và không cấu thành, lời khuyên hoặc khuyến nghị về tài chính, đầu tư, giao dịch hay các loại khác do TradingView cung cấp hoặc xác nhận. Đọc thêm tại Điều khoản Sử dụng.
Thông báo miễn trừ trách nhiệm
Thông tin và các ấn phẩm này không nhằm mục đích, và không cấu thành, lời khuyên hoặc khuyến nghị về tài chính, đầu tư, giao dịch hay các loại khác do TradingView cung cấp hoặc xác nhận. Đọc thêm tại Điều khoản Sử dụng.