
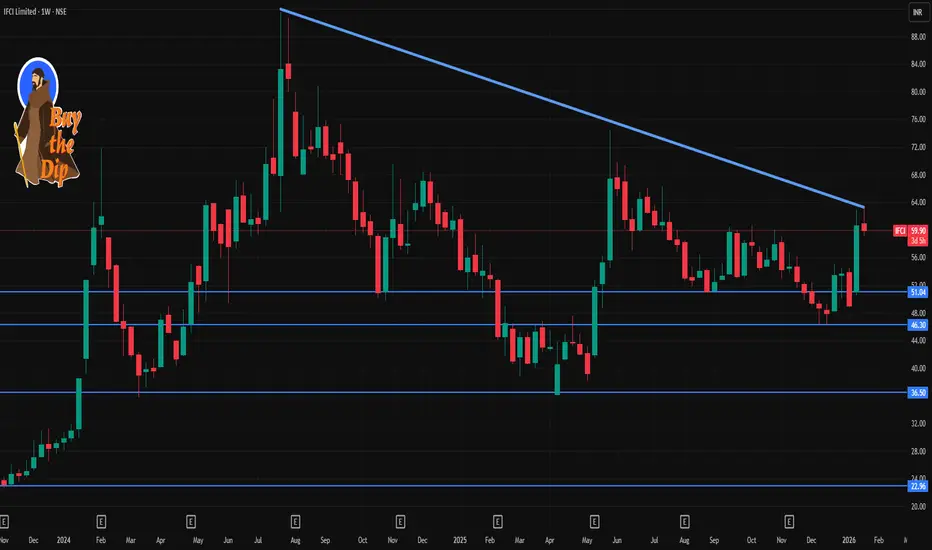
📌 Current Price Range: ~₹60–₹62 (latest prices reported)
📊 Weekly Technical Levels (1‑Week Time Frame)
Resistance Levels (Upside Targets)
~₹62.2 – First near‑term resistance (weekly reaction zone)
~₹63.6–₹64 – Next resistance cluster and weekly pivot barrier
~₹66–₹69 – Higher resistance zone from classic pivots or multi‑period levels
➡️ These levels act as potential upside caps in a rally over the next few sessions or week. A clean breakout above these with volume could shift bias higher.
Support Levels (Downside Defenses)
~₹56–₹57 – Near support just below current price (week pivot S1/S2)
~₹54–₹55 – Secondary support – often watched if weakness extends
~₹52–₹52.5 – Lower support zone which has historically acted as swing low support in prior ranges
➡️ These levels can be used as short‑term stop or trend invalidation points; if violated, a deeper pullback may unfold.
🕒 How Traders Use These Levels
Level Type Typical Use
Support Place stops just below, monitor for bounce entries
Resistance Consider partial profit booking or watch for breakout
Pivot Midpoint for bias (above → bullish, below → bearish)
👉 A break and sustained close above ₹63.6–₹64 on weekly candles could indicate continuation to the next leg up. Conversely, a close below ₹56 may suggest short‑term weakness. Always confirm with volume & momentum.

Contact Knowledgehub for a detailed consultation: Dm on WhatsApp: [wa.link/a2o0kz]-
Phone No: [+91 93102 26243]-
Email: [tradingviewknowledgehub@gmail.com]---
-- Let’s achieve success together!
Phone No: [+91 93102 26243]-
Email: [tradingviewknowledgehub@gmail.com]---
-- Let’s achieve success together!
Bài đăng liên quan
Thông báo miễn trừ trách nhiệm
Thông tin và các ấn phẩm này không nhằm mục đích, và không cấu thành, lời khuyên hoặc khuyến nghị về tài chính, đầu tư, giao dịch hay các loại khác do TradingView cung cấp hoặc xác nhận. Đọc thêm tại Điều khoản Sử dụng.