
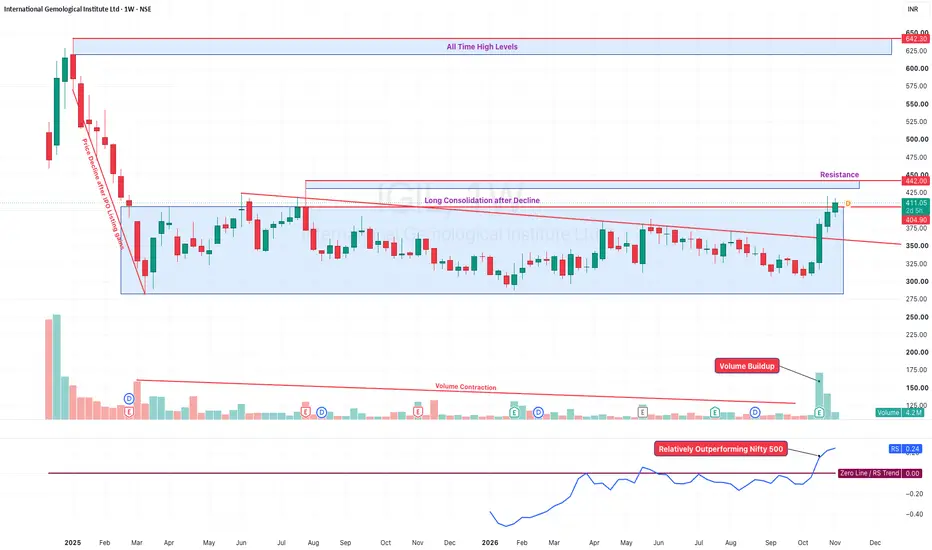
IGIL is showing encouraging signs of a potential momentum reversal on the weekly chart after a prolonged consolidation phase.
Following a significant decline from its earlier highs(IPO Listing HIghs), the stock spent several months consolidating within a broad range of approximately ₹285–₹410. Recently, price has broken above the descending trendline and is now attempting to move beyond the upper boundary of this consolidation range.
Key Technical Observations
Long Consolidation: The stock has spent several months building a base after its earlier decline.
Trendline Breakout: Price has moved above the descending trendline, indicating improving price momentum.
Breakout Attempt: The stock is currently trading around ₹411.75, attempting to move above the upper consolidation boundary.
Volume Expansion: Recent candles are accompanied by significant volume buildup, suggesting increasing market participation.
Relative Strength: The RS line has moved above the zero line, indicating improving relative performance against the Nifty 500 benchmark.
Important Levels to Watch
₹410(Weekly Closing Basis): Upper boundary of the prolonged consolidation range.
₹435–₹445: Next major resistance zone.
₹620–₹640: Historical All-Time High zone.
What Next?
The immediate focus is on whether IGIL can sustain above the ₹410 zone with a convincing weekly close.
A confirmed breakout followed by sustained price action could open the possibility of further momentum towards the ₹435–₹445 resistance zone.
However, if the stock fails to sustain above the consolidation boundary, we could see some more sideways movement before a fresh breakout attempt.
My Take: The combination of a descending trendline breakout, volume expansion and improving relative strength makes IGI an interesting stock to track. The setup is improving, but weekly breakout confirmation is still important.
Do you think IGI is preparing for a fresh momentum phase, or will it need more time to consolidate?
Disclaimer: This is a technical chart study for educational purposes only and not a buy/sell recommendation. Analysis is based on the chart dated November 6, 2026. The current weekly candle is still forming, so the closing price and volume may change.
Following a significant decline from its earlier highs(IPO Listing HIghs), the stock spent several months consolidating within a broad range of approximately ₹285–₹410. Recently, price has broken above the descending trendline and is now attempting to move beyond the upper boundary of this consolidation range.
Key Technical Observations
Long Consolidation: The stock has spent several months building a base after its earlier decline.
Trendline Breakout: Price has moved above the descending trendline, indicating improving price momentum.
Breakout Attempt: The stock is currently trading around ₹411.75, attempting to move above the upper consolidation boundary.
Volume Expansion: Recent candles are accompanied by significant volume buildup, suggesting increasing market participation.
Relative Strength: The RS line has moved above the zero line, indicating improving relative performance against the Nifty 500 benchmark.
Important Levels to Watch
₹410(Weekly Closing Basis): Upper boundary of the prolonged consolidation range.
₹435–₹445: Next major resistance zone.
₹620–₹640: Historical All-Time High zone.
What Next?
The immediate focus is on whether IGIL can sustain above the ₹410 zone with a convincing weekly close.
A confirmed breakout followed by sustained price action could open the possibility of further momentum towards the ₹435–₹445 resistance zone.
However, if the stock fails to sustain above the consolidation boundary, we could see some more sideways movement before a fresh breakout attempt.
My Take: The combination of a descending trendline breakout, volume expansion and improving relative strength makes IGI an interesting stock to track. The setup is improving, but weekly breakout confirmation is still important.
Do you think IGI is preparing for a fresh momentum phase, or will it need more time to consolidate?
Disclaimer: This is a technical chart study for educational purposes only and not a buy/sell recommendation. Analysis is based on the chart dated November 6, 2026. The current weekly candle is still forming, so the closing price and volume may change.

Bài đăng liên quan
Thông báo miễn trừ trách nhiệm
Thông tin và các ấn phẩm này không nhằm mục đích, và không cấu thành, lời khuyên hoặc khuyến nghị về tài chính, đầu tư, giao dịch hay các loại khác do TradingView cung cấp hoặc xác nhận. Đọc thêm tại Điều khoản Sử dụng.
Bài đăng liên quan
Thông báo miễn trừ trách nhiệm
Thông tin và các ấn phẩm này không nhằm mục đích, và không cấu thành, lời khuyên hoặc khuyến nghị về tài chính, đầu tư, giao dịch hay các loại khác do TradingView cung cấp hoặc xác nhận. Đọc thêm tại Điều khoản Sử dụng.