
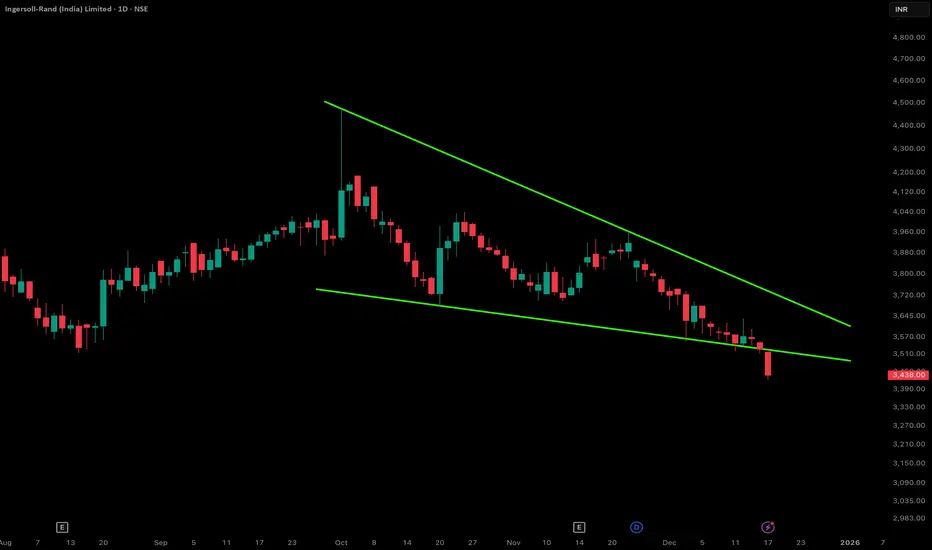
The Setup Traders often look at Falling Wedges and blindly assume a bullish reversal is coming. Ingersoll Rand (NSE: INGERRAND) has just provided a textbook example of why "Assumption" is dangerous in trading.
Instead of breaking out to the upside, the price has sliced through the Lower Support Trendline on the Daily timeframe.
Technical Breakdown (The "Trap"):
Pattern Failure: The stock was forming a Falling Wedge (usually bullish). The market expected a bounce from the lower support.
The Invalidating Move: The recent heavy-volume candle breaking below the wedge support changes the structure entirely.
Psychology of the Short: Bulls who accumulated at the support line are now trapped. As their Stop Losses get hit, it creates a cascade of selling pressure (Long Liquidation).
Trade Management (Bearish):
Signal: The daily close below the wedge support (Current levels: ~3,438).
Conservative Entry: Wait for a "Retest" of the broken trendline from below (proving old support has become new resistance).
Trend Invalidation: A daily close back inside the wedge (above ~3,550). If it re-enters, the breakdown was a "Bear Trap."
Potential Target: Since this is a continuation of the downtrend, we look at the next major structural support zones (Psychological levels like 3,200 or 3,000).
Risological Note: We trade what we see, not what the textbook says should happen. A failed bullish pattern is often a stronger bearish signal than a standard downtrend.
Instead of breaking out to the upside, the price has sliced through the Lower Support Trendline on the Daily timeframe.
Technical Breakdown (The "Trap"):
Pattern Failure: The stock was forming a Falling Wedge (usually bullish). The market expected a bounce from the lower support.
The Invalidating Move: The recent heavy-volume candle breaking below the wedge support changes the structure entirely.
Psychology of the Short: Bulls who accumulated at the support line are now trapped. As their Stop Losses get hit, it creates a cascade of selling pressure (Long Liquidation).
Trade Management (Bearish):
Signal: The daily close below the wedge support (Current levels: ~3,438).
Conservative Entry: Wait for a "Retest" of the broken trendline from below (proving old support has become new resistance).
Trend Invalidation: A daily close back inside the wedge (above ~3,550). If it re-enters, the breakdown was a "Bear Trap."
Potential Target: Since this is a continuation of the downtrend, we look at the next major structural support zones (Psychological levels like 3,200 or 3,000).
Risological Note: We trade what we see, not what the textbook says should happen. A failed bullish pattern is often a stronger bearish signal than a standard downtrend.

Bài đăng liên quan
Thông báo miễn trừ trách nhiệm
Thông tin và các ấn phẩm này không nhằm mục đích, và không cấu thành, lời khuyên hoặc khuyến nghị về tài chính, đầu tư, giao dịch hay các loại khác do TradingView cung cấp hoặc xác nhận. Đọc thêm tại Điều khoản Sử dụng.
Bài đăng liên quan
Thông báo miễn trừ trách nhiệm
Thông tin và các ấn phẩm này không nhằm mục đích, và không cấu thành, lời khuyên hoặc khuyến nghị về tài chính, đầu tư, giao dịch hay các loại khác do TradingView cung cấp hoặc xác nhận. Đọc thêm tại Điều khoản Sử dụng.