
Hello Traders,
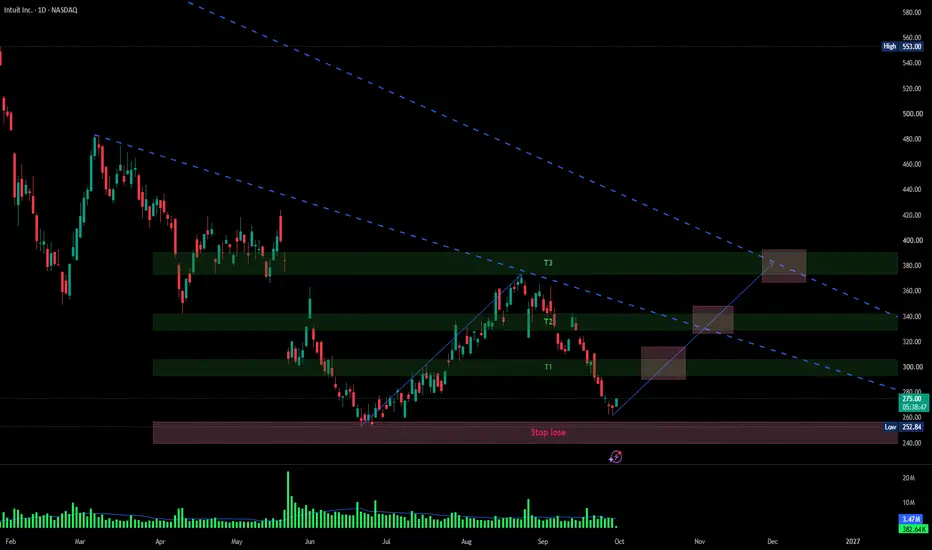
Analyzing the daily (1D) chart for Intuit Inc. (NASDAQ: INTU), it is evident that the asset has been suffocated by a severe macro downtrend, dictated by the overarching descending trendline (highlighted by the upper dashed blue line). However, current Price Action suggests we are at a critical juncture that could define a significant shift in market structure.
Market Structure & Current Price Action:
Base Building Phase: Following a brutal sell-off, the price is attempting to carve out a foundational base near its recent lows. The current pullback is a direct retest of a critical structural support zone (highlighted by the red box below the $268 level).
The Reversal Setup: If buyers can successfully defend this red zone, it will establish a structural higher low (or a double bottom), providing an early signal of seller exhaustion and the potential inception of a micro uptrend (as projected by the grey arrow).
Roadmap & Liquidity Targets:
Should the bounce materialize from this support base, we are looking to systematically reclaim the historical supply zones (the green blocks):
Target 1 (T1): Reclaiming the immediate structural resistance and breaking the sequence of local lower highs.
Target 2 (T2): Pushing into the mid-range structural liquidity block.
Target 3 (T3): The ultimate test. This zone aligns with a major structural resistance block and coincides perfectly with a test of the macro descending trendline (dashed blue line).
Invalidation & Stop Loss: Strict risk management is non-negotiable here. The "Stop loss" zone is clearly defined (the dark red rectangle at the bottom). A definitive break and daily close below this red structural base will completely invalidate the bullish reversal thesis, signaling a continuation of the macro downtrend and exposing the asset to new lows.
Let me know your thoughts in the comments—do you think INTU has found its macro bottom?
Happy trading everyone! 📈
Disclaimer: This analysis is strictly for educational and informational purposes only, intended to illustrate price action and chart structure. It does not constitute financial advice, nor is it a recommendation to buy or sell any security. Trading involves risks, and you should always conduct your own research (DYOR) before making any investment decisions.
Analyzing the daily (1D) chart for Intuit Inc. (NASDAQ: INTU), it is evident that the asset has been suffocated by a severe macro downtrend, dictated by the overarching descending trendline (highlighted by the upper dashed blue line). However, current Price Action suggests we are at a critical juncture that could define a significant shift in market structure.
Market Structure & Current Price Action:
Base Building Phase: Following a brutal sell-off, the price is attempting to carve out a foundational base near its recent lows. The current pullback is a direct retest of a critical structural support zone (highlighted by the red box below the $268 level).
The Reversal Setup: If buyers can successfully defend this red zone, it will establish a structural higher low (or a double bottom), providing an early signal of seller exhaustion and the potential inception of a micro uptrend (as projected by the grey arrow).
Roadmap & Liquidity Targets:
Should the bounce materialize from this support base, we are looking to systematically reclaim the historical supply zones (the green blocks):
Target 1 (T1): Reclaiming the immediate structural resistance and breaking the sequence of local lower highs.
Target 2 (T2): Pushing into the mid-range structural liquidity block.
Target 3 (T3): The ultimate test. This zone aligns with a major structural resistance block and coincides perfectly with a test of the macro descending trendline (dashed blue line).
Invalidation & Stop Loss: Strict risk management is non-negotiable here. The "Stop loss" zone is clearly defined (the dark red rectangle at the bottom). A definitive break and daily close below this red structural base will completely invalidate the bullish reversal thesis, signaling a continuation of the macro downtrend and exposing the asset to new lows.
Let me know your thoughts in the comments—do you think INTU has found its macro bottom?
Happy trading everyone! 📈
Disclaimer: This analysis is strictly for educational and informational purposes only, intended to illustrate price action and chart structure. It does not constitute financial advice, nor is it a recommendation to buy or sell any security. Trading involves risks, and you should always conduct your own research (DYOR) before making any investment decisions.

Thông báo miễn trừ trách nhiệm
Thông tin và các ấn phẩm này không nhằm mục đích, và không cấu thành, lời khuyên hoặc khuyến nghị về tài chính, đầu tư, giao dịch hay các loại khác do TradingView cung cấp hoặc xác nhận. Đọc thêm tại Điều khoản Sử dụng.
Thông báo miễn trừ trách nhiệm
Thông tin và các ấn phẩm này không nhằm mục đích, và không cấu thành, lời khuyên hoặc khuyến nghị về tài chính, đầu tư, giao dịch hay các loại khác do TradingView cung cấp hoặc xác nhận. Đọc thêm tại Điều khoản Sử dụng.