
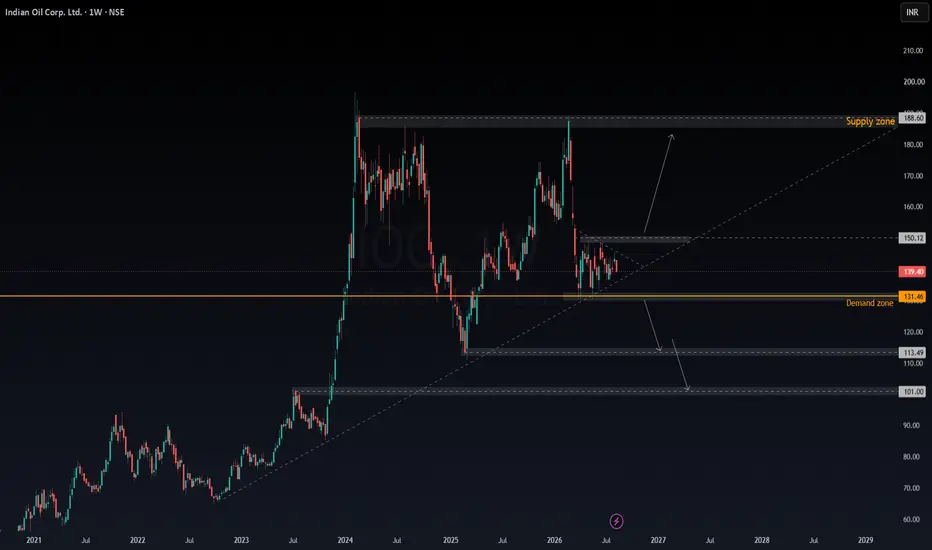
Indian Oil Corporation is currently trading in a consolidation phase on the weekly timeframe, with price moving between a major demand zone near ₹131–132 and an immediate resistance area around ₹145–150.
The bigger picture still looks constructive as long as the long-term rising structure remains intact. However, at the current level, I would prefer to wait for confirmation rather than anticipate the next move.
Bullish scenario:
A strong weekly close above ₹145–150, followed by a successful retest, could indicate that the consolidation is breaking to the upside. In that case, ₹160–170 could be the next area to watch, followed by the major supply zone around ₹185–189.
Bearish scenario:
If ₹131–132 fails to hold on a weekly closing basis, the structure could weaken significantly. In that case, ₹113–114 becomes the next important support, followed by the ₹101 area.
For me, the key levels are simple:
₹150 → bullish breakout confirmation
₹131–132 → major demand / support
₹113–114 → next downside support
₹101 → deeper support
₹185–189 → major supply zone
Right now, I'm treating this as a wait-for-confirmation setup rather than predicting the direction.
Let's see which side of the range price breaks first. 📈📉

Thông báo miễn trừ trách nhiệm
Thông tin và các ấn phẩm này không nhằm mục đích, và không cấu thành, lời khuyên hoặc khuyến nghị về tài chính, đầu tư, giao dịch hay các loại khác do TradingView cung cấp hoặc xác nhận. Đọc thêm tại Điều khoản Sử dụng.
Thông báo miễn trừ trách nhiệm
Thông tin và các ấn phẩm này không nhằm mục đích, và không cấu thành, lời khuyên hoặc khuyến nghị về tài chính, đầu tư, giao dịch hay các loại khác do TradingView cung cấp hoặc xác nhận. Đọc thêm tại Điều khoản Sử dụng.