Giá mua
IOSTBTC Fractal movement
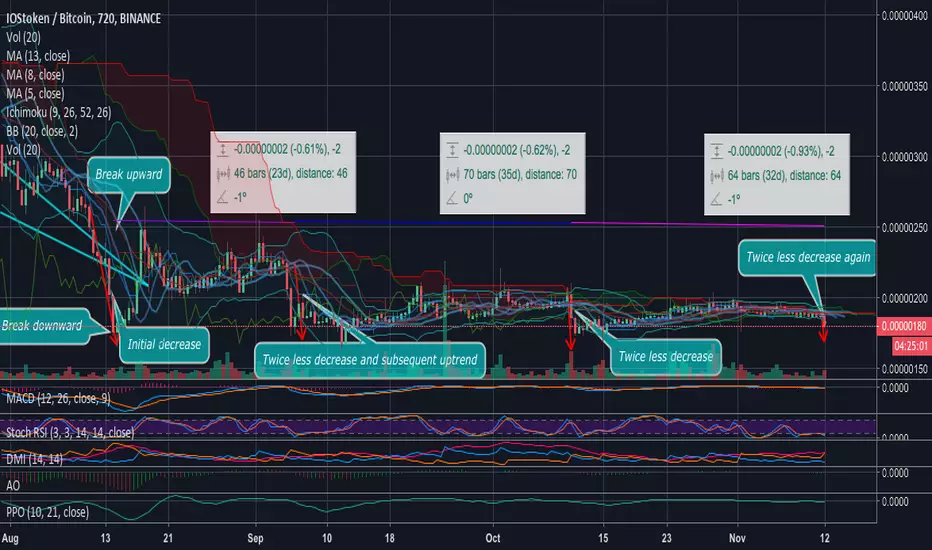
At the 12-hours timeframe chart we can observe 180 candles which equals to 90 days. Such frame can reveal patterns that the price movement repeats. One of them is a sharp decrease which becomes smaller and smaller time to time. It started after a double break of the descending triangle. The price can not consolidate: it either being pumped and moves lateral or goes sharply down.
We can observe an uptrend after each decrease which lasts at least 46 candles which equals to 23 days. According to Technical analysis indicators are bullish, while Stoch RSI is in the oversold zone and DMI suggest an upcoming volatility, while volume grows. These are elements of a strong basis for a trend reverse forecast for this coin
Carefully follow the targets in the signal to maximize profit from the price movement
We can observe an uptrend after each decrease which lasts at least 46 candles which equals to 23 days. According to Technical analysis indicators are bullish, while Stoch RSI is in the oversold zone and DMI suggest an upcoming volatility, while volume grows. These are elements of a strong basis for a trend reverse forecast for this coin
Carefully follow the targets in the signal to maximize profit from the price movement
Ghi chú
The price finally reached our specified level and will now bounce up to the targets
Thông báo miễn trừ trách nhiệm
Thông tin và các ấn phẩm này không nhằm mục đích, và không cấu thành, lời khuyên hoặc khuyến nghị về tài chính, đầu tư, giao dịch hay các loại khác do TradingView cung cấp hoặc xác nhận. Đọc thêm tại Điều khoản Sử dụng.
Thông báo miễn trừ trách nhiệm
Thông tin và các ấn phẩm này không nhằm mục đích, và không cấu thành, lời khuyên hoặc khuyến nghị về tài chính, đầu tư, giao dịch hay các loại khác do TradingView cung cấp hoặc xác nhận. Đọc thêm tại Điều khoản Sử dụng.