
WEEKLY
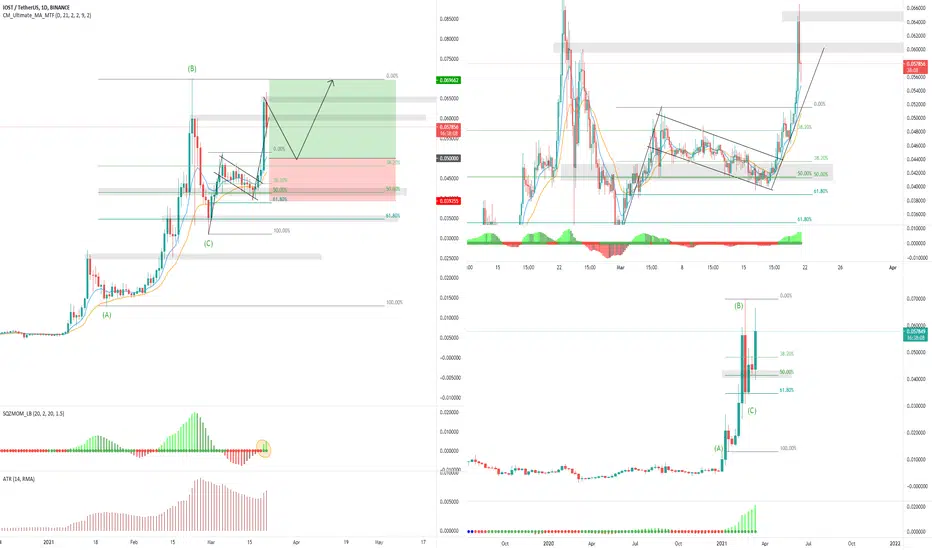
Price currently showing strong weekly bullish momentum since January 11th, after forming a high from the A-B impulse wave, before retracing to the 61.8% fibonacci level.
DAILY
After the weekly retracement to the 61.8% fibonacci levrel price began consolidating and formed a bullish flag pattern which began on the 5th of March until the 18th. Price finally broke resistance of the upper trend line and continue higher above the previous weekly high.
4HR
I have highlights onthe 4HR chart confluence between the weekly retracement and the daily retracement lining up with the 50% fibonacci retracement.
ENTRY
0.050000USDT
S.L
0.039255USDT
T.P
0.069662USDT
R:R
1:1.83
Price currently showing strong weekly bullish momentum since January 11th, after forming a high from the A-B impulse wave, before retracing to the 61.8% fibonacci level.
DAILY
After the weekly retracement to the 61.8% fibonacci levrel price began consolidating and formed a bullish flag pattern which began on the 5th of March until the 18th. Price finally broke resistance of the upper trend line and continue higher above the previous weekly high.
4HR
I have highlights onthe 4HR chart confluence between the weekly retracement and the daily retracement lining up with the 50% fibonacci retracement.
ENTRY
0.050000USDT
S.L
0.039255USDT
T.P
0.069662USDT
R:R
1:1.83

Thông báo miễn trừ trách nhiệm
Thông tin và các ấn phẩm này không nhằm mục đích, và không cấu thành, lời khuyên hoặc khuyến nghị về tài chính, đầu tư, giao dịch hay các loại khác do TradingView cung cấp hoặc xác nhận. Đọc thêm tại Điều khoản Sử dụng.
Thông báo miễn trừ trách nhiệm
Thông tin và các ấn phẩm này không nhằm mục đích, và không cấu thành, lời khuyên hoặc khuyến nghị về tài chính, đầu tư, giao dịch hay các loại khác do TradingView cung cấp hoặc xác nhận. Đọc thêm tại Điều khoản Sử dụng.