Timeframe: Weekly (1W)
Chart price: ₹104.56
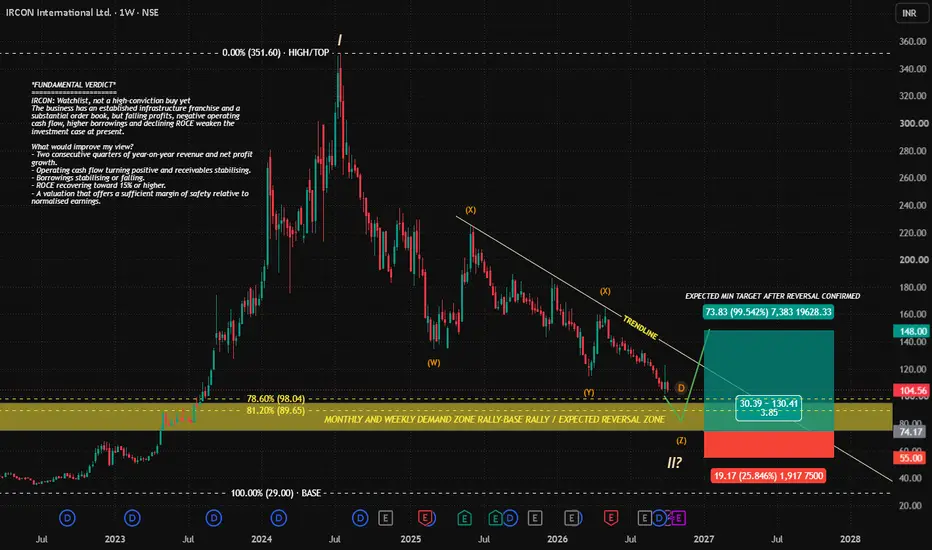
IRCON has corrected sharply from its 2024 peak near ₹351.60. The current chart presents a potential complex Elliott Wave correction, with the marked W–X–Y structure suggesting that the decline may be developing as a combination correction.
1. Potential Corrective Structure: W–X–Y–Z
2. Fibonacci Confluence and Demand Zone
The marked Fibonacci levels are:
The overlap between the projected corrective structure and the demand zone makes this area important to monitor. However, Fibonacci confluence identifies a potential reaction area; it does not confirm that the wave count has finished.
3. What Would Confirm the Reversal?
For the bullish Elliott Wave interpretation to gain credibility, I would look for:
4. Upside Scenario
Following a confirmed reversal, the chart identifies the following reference areas:
5. Invalidation and Bearish Alternative
Conclusion
IRCON is approaching a potentially important completion zone for its corrective structure, but Wave Z completion is not yet confirmed.
The key is to observe whether the ₹80–₹98 demand zone attracts buyers and whether price subsequently breaks the descending trendline. Until then, the prevailing weekly trend remains bearish.
The technical setup is developing in a stock with an established railway infrastructure business and a substantial order book. However, weaker earnings, negative operating cash flow and declining returns on capital remain fundamental risks.
For that reason, I would treat a potential Elliott Wave reversal as a trading hypothesis until both price structure and business performance improve.
Disclaimer
Elliott Wave counts are interpretive and subject to revision as new price data develops. This is a conditional technical scenario, not a guaranteed forecast or investment recommendation.
This analysis on IRCON is strictly for educational purpose only, and not an investment/ financial advise.
Chart price: ₹104.56
IRCON has corrected sharply from its 2024 peak near ₹351.60. The current chart presents a potential complex Elliott Wave correction, with the marked W–X–Y structure suggesting that the decline may be developing as a combination correction.
1. Potential Corrective Structure: W–X–Y–Z
- Wave W: The first major corrective decline following the peak.
- Wave X: An intervening recovery that temporarily interrupted the downtrend.
- Wave Y: A subsequent decline that established another lower low.
- Wave Z (provisional): The chart allows for the possibility that a final corrective leg remains incomplete, potentially extending into the monthly and weekly demand zone.
2. Fibonacci Confluence and Demand Zone
The marked Fibonacci levels are:
- 78.6% retracement: ₹98.04
- 81.2% retracement: ₹89.65
- Major demand zone: Approximately ₹80–₹98
- Lower technical reference: ₹74.17
The overlap between the projected corrective structure and the demand zone makes this area important to monitor. However, Fibonacci confluence identifies a potential reaction area; it does not confirm that the wave count has finished.
3. What Would Confirm the Reversal?
For the bullish Elliott Wave interpretation to gain credibility, I would look for:
- Price to stabilise within or above the demand zone.
- A bullish weekly reversal followed by a higher low.
- A break above the nearest meaningful swing high.
- A sustained breakout above the descending trendline.
- If these conditions develop, the market may be transitioning from a corrective decline into a new bullish recovery phase.
4. Upside Scenario
Following a confirmed reversal, the chart identifies the following reference areas:
- ₹120–₹130: Initial recovery and structural resistance area.
- ₹148: Main projected upside target on the chart.
- Above ₹148: Further recovery would require fresh price confirmation and a reassessment of the Elliott Wave structure.
- The ₹148 projection is conditional, not a guaranteed target. From ₹104.56, it represents approximately 41.5% upside; the chart's approximately 99.5% projection is measured from ₹74.17.
5. Invalidation and Bearish Alternative
- If IRCON fails to hold the demand zone and breaks below ₹74.17, the bullish reversal thesis weakens considerably. The ₹55 level is the lower risk reference marked on the chart.
- A breakdown would raise the possibility that the corrective structure is extending or that the proposed W–X–Y–Z count needs to be revised.
Conclusion
IRCON is approaching a potentially important completion zone for its corrective structure, but Wave Z completion is not yet confirmed.
The key is to observe whether the ₹80–₹98 demand zone attracts buyers and whether price subsequently breaks the descending trendline. Until then, the prevailing weekly trend remains bearish.
The technical setup is developing in a stock with an established railway infrastructure business and a substantial order book. However, weaker earnings, negative operating cash flow and declining returns on capital remain fundamental risks.
For that reason, I would treat a potential Elliott Wave reversal as a trading hypothesis until both price structure and business performance improve.
Disclaimer
Elliott Wave counts are interpretive and subject to revision as new price data develops. This is a conditional technical scenario, not a guaranteed forecast or investment recommendation.
This analysis on
IRCON is strictly for educational purpose only, and not an investment/ financial advise. 
Thông báo miễn trừ trách nhiệm
Thông tin và các ấn phẩm này không nhằm mục đích, và không cấu thành, lời khuyên hoặc khuyến nghị về tài chính, đầu tư, giao dịch hay các loại khác do TradingView cung cấp hoặc xác nhận. Đọc thêm tại Điều khoản Sử dụng.
Thông báo miễn trừ trách nhiệm
Thông tin và các ấn phẩm này không nhằm mục đích, và không cấu thành, lời khuyên hoặc khuyến nghị về tài chính, đầu tư, giao dịch hay các loại khác do TradingView cung cấp hoặc xác nhận. Đọc thêm tại Điều khoản Sử dụng.