
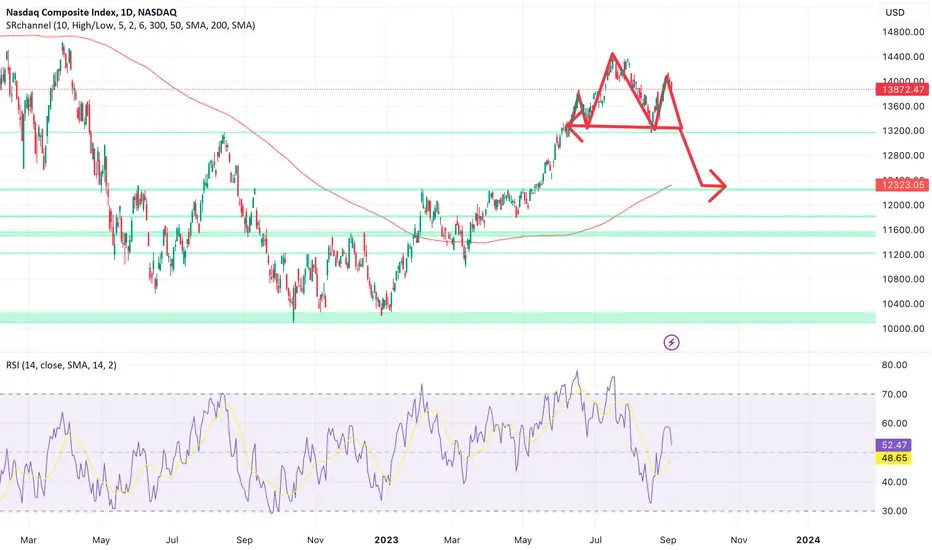
NASDAQ is forming a potential head and shoulder pattern
The neck line of this shoulder is 13247
If it goes below that or the daily candle close below that level that means the bearish trend will start
Looking @ DXY also it seems it is coinciding as usual with the potential down turn of the market .
20 Sept is the Fed event and that can bring the news to push the market down
The strong support level is 12289 level
Anything around 12k area should be a strong buy as the bound from this level would be amazing,
The neck line of this shoulder is 13247
If it goes below that or the daily candle close below that level that means the bearish trend will start
Looking @ DXY also it seems it is coinciding as usual with the potential down turn of the market .
20 Sept is the Fed event and that can bring the news to push the market down
The strong support level is 12289 level
Anything around 12k area should be a strong buy as the bound from this level would be amazing,
Ghi chú
So it has indeed crossed the neck line and looks like we are going to go back to 12800 or 12300 levels . Great shopping time coming ahead
Thông báo miễn trừ trách nhiệm
Thông tin và các ấn phẩm này không nhằm mục đích, và không cấu thành, lời khuyên hoặc khuyến nghị về tài chính, đầu tư, giao dịch hay các loại khác do TradingView cung cấp hoặc xác nhận. Đọc thêm tại Điều khoản Sử dụng.
Thông báo miễn trừ trách nhiệm
Thông tin và các ấn phẩm này không nhằm mục đích, và không cấu thành, lời khuyên hoặc khuyến nghị về tài chính, đầu tư, giao dịch hay các loại khác do TradingView cung cấp hoặc xác nhận. Đọc thêm tại Điều khoản Sử dụng.