
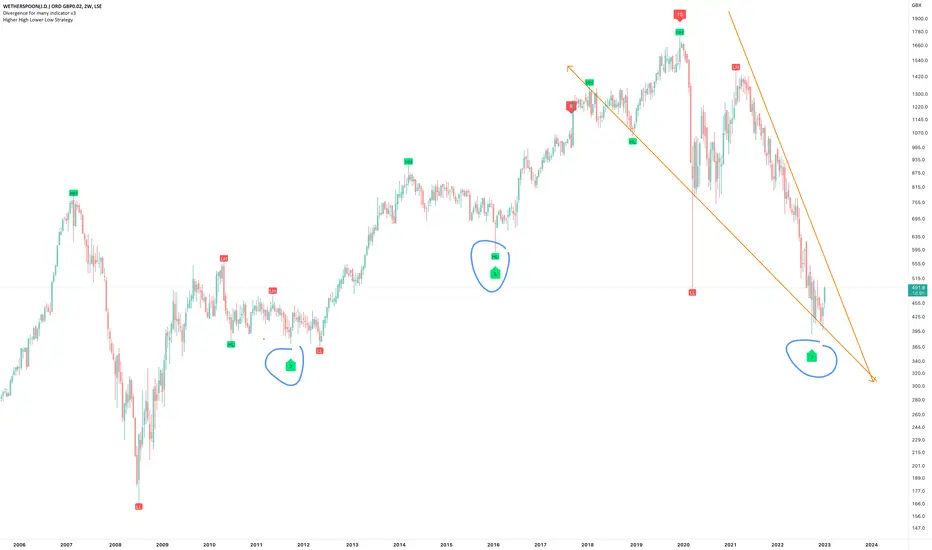
On the above 2-week chart price action has corrected 75% since the sell signal (not shown) in October 2019 @ 1600. Now is an excellent moment for a long trade position. Why?
1) A strong buy prints (not shown).
2) Strong bullish divergence. Blue circles. Look left.
3) Falling wedge is yet to breakout however with points 1 and 2 we can be confident in the direction.
4) The UK economy is circling the drain hole, it makes sense alcohol consumption will be on the up!
Is it possible for price action to fall further? For sure.
Is it probable? No.
Ww
Type: trade. Yes trade, not investment.
Risk: <=6% of portfolio
Timeframe: Don’t know.
Return: Don’t know
Stop loss: <=$380
1) A strong buy prints (not shown).
2) Strong bullish divergence. Blue circles. Look left.
3) Falling wedge is yet to breakout however with points 1 and 2 we can be confident in the direction.
4) The UK economy is circling the drain hole, it makes sense alcohol consumption will be on the up!
Is it possible for price action to fall further? For sure.
Is it probable? No.
Ww
Type: trade. Yes trade, not investment.
Risk: <=6% of portfolio
Timeframe: Don’t know.
Return: Don’t know
Stop loss: <=$380
Ghi chú
** Swing trade opportunity **Price action is up 60% and overbought. Wait for 550 and below. Not trading this so you must ask below for an update.
Giao dịch được đóng thủ công
50% win since the start of the year. Strong probability price action now corrects.2-week
Giao dịch đang hoạt động
WAVE 3 underway.
Thông báo miễn trừ trách nhiệm
Thông tin và các ấn phẩm này không nhằm mục đích, và không cấu thành, lời khuyên hoặc khuyến nghị về tài chính, đầu tư, giao dịch hay các loại khác do TradingView cung cấp hoặc xác nhận. Đọc thêm tại Điều khoản Sử dụng.
Thông báo miễn trừ trách nhiệm
Thông tin và các ấn phẩm này không nhằm mục đích, và không cấu thành, lời khuyên hoặc khuyến nghị về tài chính, đầu tư, giao dịch hay các loại khác do TradingView cung cấp hoặc xác nhận. Đọc thêm tại Điều khoản Sử dụng.