Giá mua
JNH Resumes Uptrend? Trade Setup (>100% Potential Profits)
Hello Fellow Traders,
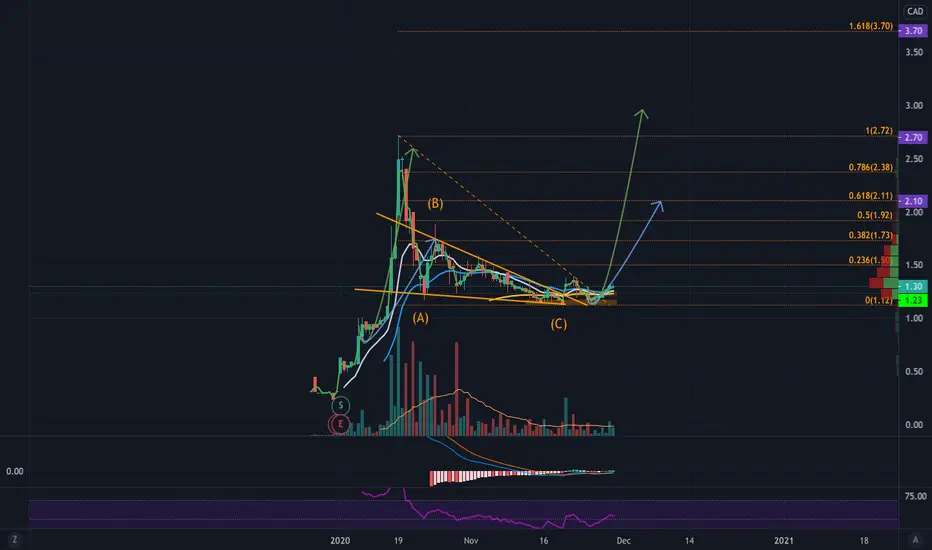
Here we are looking at Jack Nathan Medical Corp (JNH) on the TSXV. As we can see, this is a relatively new chart which rallied throughout October, reaching a high of $2.72.
The price has since corrected and formed a bullish falling wedge pattern. Additionally, following a breakout from the wedge, it has printed a double bottom in the $1.10-$1.15 range. Prices are now trading above the 10, 21, 50 EMAs on the 4H chart. We can see increasing volume, the RSI has risen above 50, and the MACD is increasing as well, all bullish signals.
Depending on how quickly this chart picks up, we could see massive growth, so I have marked some potential paths for the next bullish wave. Prices can easily move up from here. In the long term, a breakout past the high of $2.72 would allow for additional growth, with a target at the 1.618 Fib level of $3.70 (+184%). A potential trade setup now may be:
Entry: $1.20-$1.40
Targets: $2.10 (+61%) | $2.70 (+107%) | $3.70 (+183%)
Stop loss: $1.05 (-20%)
Let me know what you think down below and leave a like if you appreciate the analysis. Also, check out my profile or some of the related ideas below and be sure to follow for more chart analyses and profitable trade setups!
Price at writing: $1.30

Bài đăng liên quan
Thông báo miễn trừ trách nhiệm
Thông tin và các ấn phẩm này không nhằm mục đích, và không cấu thành, lời khuyên hoặc khuyến nghị về tài chính, đầu tư, giao dịch hay các loại khác do TradingView cung cấp hoặc xác nhận. Đọc thêm tại Điều khoản Sử dụng.
Bài đăng liên quan
Thông báo miễn trừ trách nhiệm
Thông tin và các ấn phẩm này không nhằm mục đích, và không cấu thành, lời khuyên hoặc khuyến nghị về tài chính, đầu tư, giao dịch hay các loại khác do TradingView cung cấp hoặc xác nhận. Đọc thêm tại Điều khoản Sử dụng.