

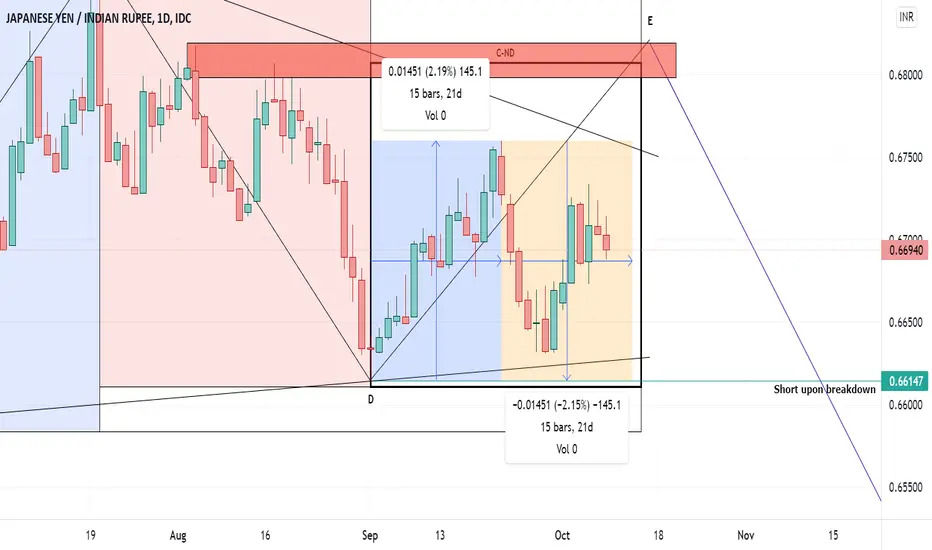
In continuation to the linked idea titled as "Update 1-JPY/INR", this post explains what's going on in wave E.

In the above chart there are 2 shaded areas in wave E indicated inside bold black bordered box.
Blue shaded area is the price action to the upside and the orange one is to the downside.
If the price action in the orange shaded area breaks below the blue shaded area on or before 13/10/2021 then it keeps a full stop to the whole correction by completing wave E and the triangle and the downtrend continues else the price action inside the orange area is a corrective wave to the one in blue area.
Keep watching this space for further updates.
To understand the concepts behind my analysis please checkout the linked idea. Happy trading :)
In the above chart there are 2 shaded areas in wave E indicated inside bold black bordered box.
Blue shaded area is the price action to the upside and the orange one is to the downside.
If the price action in the orange shaded area breaks below the blue shaded area on or before 13/10/2021 then it keeps a full stop to the whole correction by completing wave E and the triangle and the downtrend continues else the price action inside the orange area is a corrective wave to the one in blue area.
Keep watching this space for further updates.
To understand the concepts behind my analysis please checkout the linked idea. Happy trading :)

Bài đăng liên quan
Thông báo miễn trừ trách nhiệm
Thông tin và các ấn phẩm này không nhằm mục đích, và không cấu thành, lời khuyên hoặc khuyến nghị về tài chính, đầu tư, giao dịch hay các loại khác do TradingView cung cấp hoặc xác nhận. Đọc thêm tại Điều khoản Sử dụng.
Bài đăng liên quan
Thông báo miễn trừ trách nhiệm
Thông tin và các ấn phẩm này không nhằm mục đích, và không cấu thành, lời khuyên hoặc khuyến nghị về tài chính, đầu tư, giao dịch hay các loại khác do TradingView cung cấp hoặc xác nhận. Đọc thêm tại Điều khoản Sử dụng.