
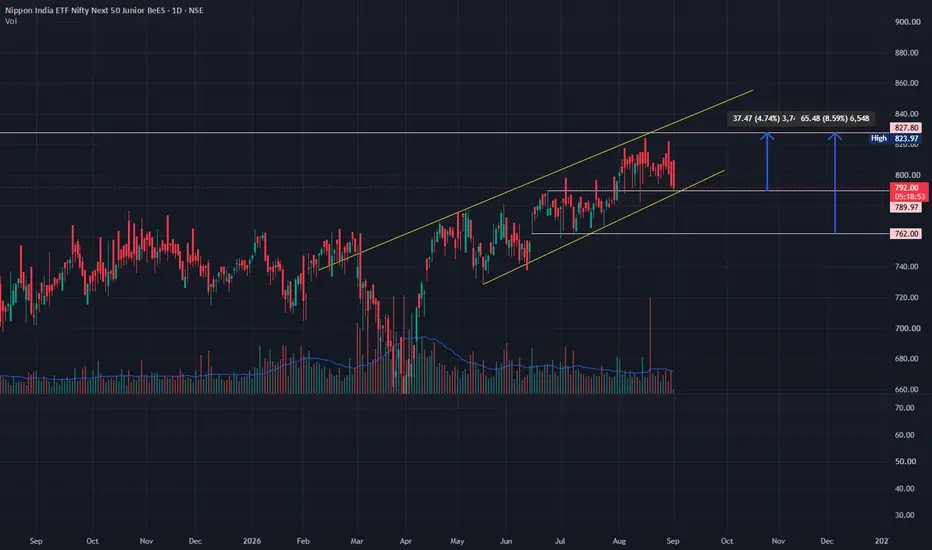
Based on the daily chart for Nippon India ETF Nifty Next 50 Junior BeES (JUNIORBEES), here is the technical breakdown and short-term levels:
Trend & Structure
Lower Boundary Test: The price is currently resting right on the lower boundary line of the ascending channel around 789.97 – 790.81.
Pullback from Highs: Following a swing high near 823.97 (High label), the ETF has pulled back over recent daily sessions to retest the trendline support.
Volume Profile: Volume levels remain moderate to low on this pullback, indicating a orderly correction rather than aggressive institutional selling.
Key Technical Levels
Immediate Resistance (Upside Target 1): 823.97 – 827.80 (Recent swing high resistance area, ~4.74% potential upside from channel support)
Upper Channel Target (Upside Target 2): 845.00 – 855.00 (Upper yellow trendline projection)
Immediate Support: 789.97 (Current lower channel trendline support level)
Major Support (Downside Target): 762.00 (Prior horizontal base consolidation low from July; target if trendline breaks)
Short-Term Scenarios
Bullish Rebound (Primary Setup): Holding above 789.97 supports a bounce back toward 823.97 (+4.7%), with extended momentum targeting the upper channel boundary (~850.00).
Bearish Breakdown (Risk Management): A daily close below 789.00 invalidates the current ascending channel, opening up downside risk toward the horizontal demand zone at 762.00 (~8.5% drop from the high).
Disclaimer - All information on this page is for educational purposes only,
we are not SEBI Registered, Please consult a SEBI registered financial advisor for your financial matters before investing And taking any decision. We are not responsible for any profit/loss you made.
Request your support and engagement by liking and commenting & follow to provide encouragement
HAPPY TRADING 👍
Trend & Structure
Lower Boundary Test: The price is currently resting right on the lower boundary line of the ascending channel around 789.97 – 790.81.
Pullback from Highs: Following a swing high near 823.97 (High label), the ETF has pulled back over recent daily sessions to retest the trendline support.
Volume Profile: Volume levels remain moderate to low on this pullback, indicating a orderly correction rather than aggressive institutional selling.
Key Technical Levels
Immediate Resistance (Upside Target 1): 823.97 – 827.80 (Recent swing high resistance area, ~4.74% potential upside from channel support)
Upper Channel Target (Upside Target 2): 845.00 – 855.00 (Upper yellow trendline projection)
Immediate Support: 789.97 (Current lower channel trendline support level)
Major Support (Downside Target): 762.00 (Prior horizontal base consolidation low from July; target if trendline breaks)
Short-Term Scenarios
Bullish Rebound (Primary Setup): Holding above 789.97 supports a bounce back toward 823.97 (+4.7%), with extended momentum targeting the upper channel boundary (~850.00).
Bearish Breakdown (Risk Management): A daily close below 789.00 invalidates the current ascending channel, opening up downside risk toward the horizontal demand zone at 762.00 (~8.5% drop from the high).
Disclaimer - All information on this page is for educational purposes only,
we are not SEBI Registered, Please consult a SEBI registered financial advisor for your financial matters before investing And taking any decision. We are not responsible for any profit/loss you made.
Request your support and engagement by liking and commenting & follow to provide encouragement
HAPPY TRADING 👍

Thông báo miễn trừ trách nhiệm
Thông tin và các ấn phẩm này không nhằm mục đích, và không cấu thành, lời khuyên hoặc khuyến nghị về tài chính, đầu tư, giao dịch hay các loại khác do TradingView cung cấp hoặc xác nhận. Đọc thêm tại Điều khoản Sử dụng.
Thông báo miễn trừ trách nhiệm
Thông tin và các ấn phẩm này không nhằm mục đích, và không cấu thành, lời khuyên hoặc khuyến nghị về tài chính, đầu tư, giao dịch hay các loại khác do TradingView cung cấp hoặc xác nhận. Đọc thêm tại Điều khoản Sử dụng.