Giá xuống
KAVABTC
Hello Crypto Lovers,
Mars Signals team wishes you high profits.
This is a 4-hour-time frame analysis for KAVABTC
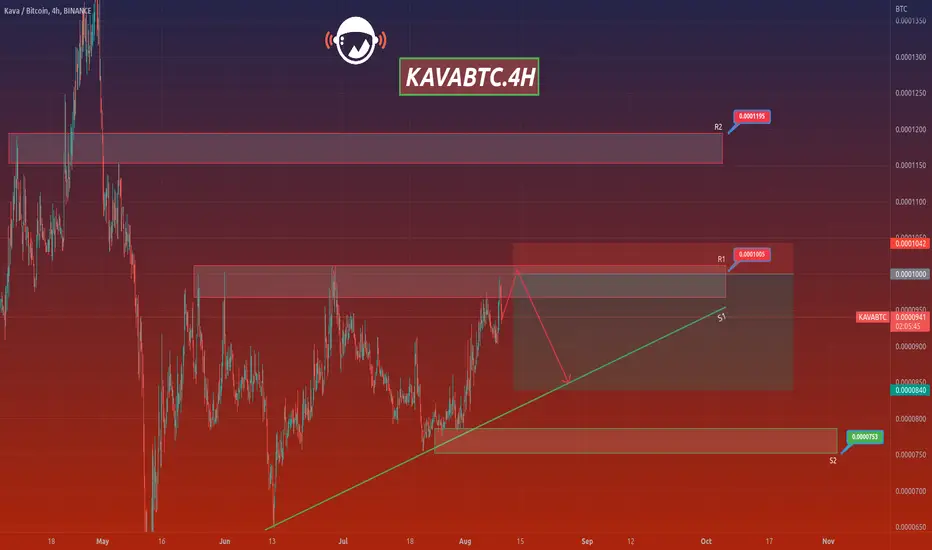
In the present chart, we have R2 and R1 as are our resistance areas that represent the disability of the price to rise. And S1 is the support line which includes the support of the price at some points. Now you observe that the price is fluctuating in R1 area and we expect it to rise to the top of R1 and then by receiving confirmation candles, we consider our short position and then we predict a decline for it toward S1. In case the price fixes over R1, we suggest you to have trades up to R2 area.
Warning: This is just a suggestion and we do not guarantee profits. We advise you to analyze the chart before opening any positions.
Wish you luck
Mars Signals team wishes you high profits.
This is a 4-hour-time frame analysis for KAVABTC
In the present chart, we have R2 and R1 as are our resistance areas that represent the disability of the price to rise. And S1 is the support line which includes the support of the price at some points. Now you observe that the price is fluctuating in R1 area and we expect it to rise to the top of R1 and then by receiving confirmation candles, we consider our short position and then we predict a decline for it toward S1. In case the price fixes over R1, we suggest you to have trades up to R2 area.
Warning: This is just a suggestion and we do not guarantee profits. We advise you to analyze the chart before opening any positions.
Wish you luck

Thông báo miễn trừ trách nhiệm
Thông tin và các ấn phẩm này không nhằm mục đích, và không cấu thành, lời khuyên hoặc khuyến nghị về tài chính, đầu tư, giao dịch hay các loại khác do TradingView cung cấp hoặc xác nhận. Đọc thêm tại Điều khoản Sử dụng.
Thông báo miễn trừ trách nhiệm
Thông tin và các ấn phẩm này không nhằm mục đích, và không cấu thành, lời khuyên hoặc khuyến nghị về tài chính, đầu tư, giao dịch hay các loại khác do TradingView cung cấp hoặc xác nhận. Đọc thêm tại Điều khoản Sử dụng.