
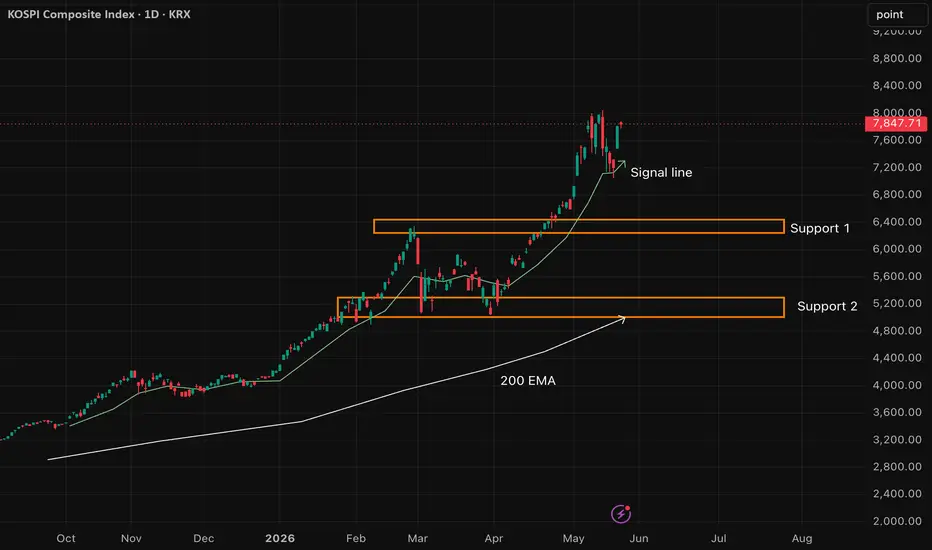
The South Korean Leitindex (KOSPI) on the Daily timeframe (1D) has shown an extraordinary performance since the beginning of the year. Backed by our algorithmic dashboard in Invest Mode, which triggered a structural entry at 2,640.57 and currently tracks a massive 197.20% Signal PnL, the market trend remains primary "BULLISH" with "STRONG" momentum power.
However, from a cyclical and technical perspective, the market is now severely overextended. A near-doubling of a major equity index within a matter of months is historically unsustainable without intermediate structural corrections. Therefore, we are anticipating a healthy cooling-off phase and potential technical retracements toward established liquidity pools below.
Downside Scenarios & Structural Support Zones:
The Immediate Trigger (Signal Line): The steep, parabolic advance is currently anchored by the ascending green dynamic signal line. A decisive daily close below this line will be the first technical confirmation that a broader mean-reversion process has begun.
Support Zone 1 (First Major Target): Located around the 6,300 – 6,400 index point level (marked as Support 1). This area represents a prominent previous structural peak printed in early March. In a standard corrective sequence, this old resistance ceiling should act as the first major line of defense where buyers might re-emerge (Resistance-turned-Support flip).
Support Zone 2 & Macro Confluence (Deep Value Target): Situated near the 5,000 – 5,200 index point zone (marked as Support 2). This represents a much deeper structural accumulation zone from earlier in the year. Crucially, the institutional 200-period Exponential Moving Average (200 EMA) (white line) is steadily ascending toward this pocket (currently near 5,009.82). If a broader global macro correction intensifies, this zone offers a very powerful compounding dynamic floor.
Strategic Conclusion
While the macro trend is undeniably strong, chasing the market at these parabolic highs carries an unfavorable risk-to-reward ratio. A temporary pullback to cool down the technical indicators is highly necessary for long-term trend sustainability. Watching for a stabilization inside Support Zone 1 or a deep-value retest near Support Zone 2 and the 200 EMA will offer significantly safer structural positioning for trend continuation.
Risk Management
A sharp, high-volume invalidation of the local consolidation patterns that prints new all-time highs would delay the corrective thesis and signal that the parabolic momentum is extending further. Strict risk management and monitoring the price action at the green signal line is key.
However, from a cyclical and technical perspective, the market is now severely overextended. A near-doubling of a major equity index within a matter of months is historically unsustainable without intermediate structural corrections. Therefore, we are anticipating a healthy cooling-off phase and potential technical retracements toward established liquidity pools below.
Downside Scenarios & Structural Support Zones:
The Immediate Trigger (Signal Line): The steep, parabolic advance is currently anchored by the ascending green dynamic signal line. A decisive daily close below this line will be the first technical confirmation that a broader mean-reversion process has begun.
Support Zone 1 (First Major Target): Located around the 6,300 – 6,400 index point level (marked as Support 1). This area represents a prominent previous structural peak printed in early March. In a standard corrective sequence, this old resistance ceiling should act as the first major line of defense where buyers might re-emerge (Resistance-turned-Support flip).
Support Zone 2 & Macro Confluence (Deep Value Target): Situated near the 5,000 – 5,200 index point zone (marked as Support 2). This represents a much deeper structural accumulation zone from earlier in the year. Crucially, the institutional 200-period Exponential Moving Average (200 EMA) (white line) is steadily ascending toward this pocket (currently near 5,009.82). If a broader global macro correction intensifies, this zone offers a very powerful compounding dynamic floor.
Strategic Conclusion
While the macro trend is undeniably strong, chasing the market at these parabolic highs carries an unfavorable risk-to-reward ratio. A temporary pullback to cool down the technical indicators is highly necessary for long-term trend sustainability. Watching for a stabilization inside Support Zone 1 or a deep-value retest near Support Zone 2 and the 200 EMA will offer significantly safer structural positioning for trend continuation.
Risk Management
A sharp, high-volume invalidation of the local consolidation patterns that prints new all-time highs would delay the corrective thesis and signal that the parabolic momentum is extending further. Strict risk management and monitoring the price action at the green signal line is key.

CH Invest and Trading
Thông báo miễn trừ trách nhiệm
Thông tin và các ấn phẩm này không nhằm mục đích, và không cấu thành, lời khuyên hoặc khuyến nghị về tài chính, đầu tư, giao dịch hay các loại khác do TradingView cung cấp hoặc xác nhận. Đọc thêm tại Điều khoản Sử dụng.
CH Invest and Trading
Thông báo miễn trừ trách nhiệm
Thông tin và các ấn phẩm này không nhằm mục đích, và không cấu thành, lời khuyên hoặc khuyến nghị về tài chính, đầu tư, giao dịch hay các loại khác do TradingView cung cấp hoặc xác nhận. Đọc thêm tại Điều khoản Sử dụng.