
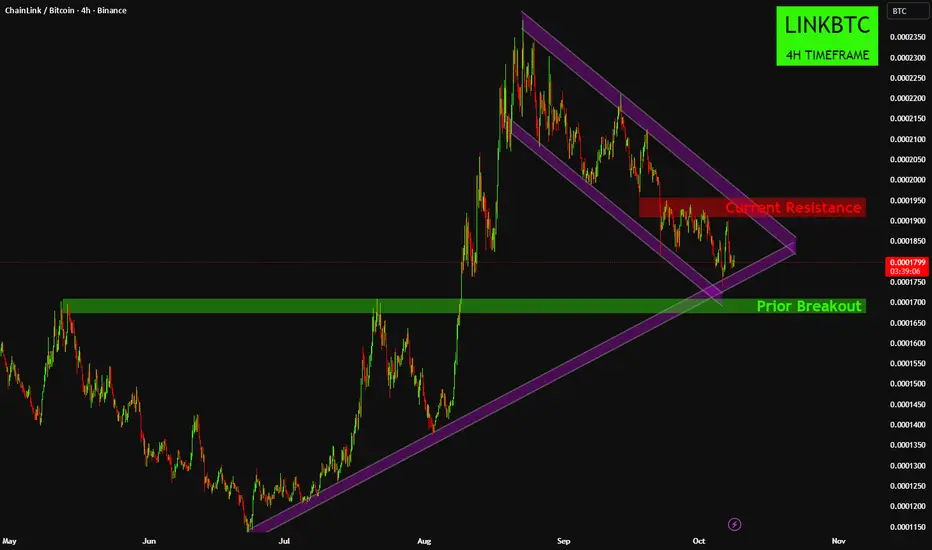
LINKBTC: Support or Bust?
Disclaimer:
The information provided in this chart is for educational and informational purposes only and should not be considered as investment advice. Trading and investing involve substantial risk and are not suitable for every investor. You should carefully consider your financial situation and consult with a financial advisor before making any investment decisions. The creator of this chart does not guarantee any specific outcome or profit and is not responsible for any losses incurred as a result of using this information. Past performance is not indicative of future results. Use this information at your own risk. This chart has been created for my own improvement in Trading and Investment Analysis. Please do your own analysis before any investments.
- ChainLink (LINKBTC) on the Daily timeframe is currently undergoing consolidation within a "Descending Channel" after a significant "Prior Breakout," with the price at approximately 0.0001802.
- Bullish Scenario: The price is currently testing a crucial confluence of support, including the lower trendline of the "Descending Channel" and a longer-term ascending trendline, aligning with the "Prior Breakout" zone; a successful defense here could lead to a retest of the "Current Resistance" around 0.0001900-0.0001950.
- Bearish Scenario (Immediate): Conversely, a confirmed breach and sustained trading below the converging support of the "Descending Channel's" lower trendline and the underlying long-term ascending trendline would signal a significant weakening of the bullish structure.
- Bearish Scenario (Deeper): Should the "Prior Breakout" zone (green area) fail to hold as support after such a breakdown, it would imply a deeper retracement and a potential reversal of the prior uptrend, negating the bullish momentum from the earlier breakout.
Disclaimer:
The information provided in this chart is for educational and informational purposes only and should not be considered as investment advice. Trading and investing involve substantial risk and are not suitable for every investor. You should carefully consider your financial situation and consult with a financial advisor before making any investment decisions. The creator of this chart does not guarantee any specific outcome or profit and is not responsible for any losses incurred as a result of using this information. Past performance is not indicative of future results. Use this information at your own risk. This chart has been created for my own improvement in Trading and Investment Analysis. Please do your own analysis before any investments.

Thông báo miễn trừ trách nhiệm
Thông tin và các ấn phẩm này không nhằm mục đích, và không cấu thành, lời khuyên hoặc khuyến nghị về tài chính, đầu tư, giao dịch hay các loại khác do TradingView cung cấp hoặc xác nhận. Đọc thêm tại Điều khoản Sử dụng.
Thông báo miễn trừ trách nhiệm
Thông tin và các ấn phẩm này không nhằm mục đích, và không cấu thành, lời khuyên hoặc khuyến nghị về tài chính, đầu tư, giao dịch hay các loại khác do TradingView cung cấp hoặc xác nhận. Đọc thêm tại Điều khoản Sử dụng.